OPEN-SOURCE SCRIPT
On Balance Volume Heikin-Ashi Transformed
Cập nhật
The OBV Heikin Ashi indicator is a modified version of the On-Balance Volume indicator that incorporates the Heikin Ashi transformation. This technical tool aims to provide traders with a smoother representation of volume dynamics and price trends.
The OBV Heikin Ashi indicator combines the principles of OBV and Heikin Ashi to offer insights into the volume and price behavior of an asset. Understanding OBV and Heikin Ashi individually will provide a foundation for comprehending the uniqueness and utility of this indicator.
On-Balance Volume:
OBV is a volume-based indicator that measures the cumulative buying and selling pressure in the market. It considers the relationship between volume and price movements to determine the overall strength and direction of a trend. Rising OBV values suggest bullish buying pressure, while falling values indicate bearish selling pressure.
Heikin Ashi:
Heikin Ashi is a Japanese candlestick charting technique that aims to filter out noise and provide a smoother representation of price trends. It calculates each candlestick based on the average of the previous candle's open, close, high, and low prices. Heikin Ashi candles can reveal the underlying trend more clearly by reducing market noise.
Methodology:
The 𝘖𝘉𝘝 𝘏-𝘈 indicator applies the Heikin Ashi transformation to the OBV values. Each OBV value is replaced with a Heikin Ashi equivalent, which is calculated based on the average of the previous Heikin Ashi candle's open and close prices. This transformation smooths out the OBV values and helps identify the overall trend with reduced noise. Additionaly, 2 optional EMAs are included for convergence-divergence analysis.
By applying the Heikin Ashi transformation to OBV, the indicator aims to enhance the readability of volume and trend information, providing traders with a clearer understanding of market dynamics.
Utility:
The 𝘖𝘉𝘝 𝘏-𝘈 indicator can be a valuable tool for traders and investors in analyzing volume and price trends. It offers a smoother representation of OBV values, allowing for easier identification of trend reversals, bullish or bearish market conditions, and potential trading opportunities. Traders can utilize the indicator to confirm price trends, validate support and resistance levels, and enhance their overall trading strategies.
It is worth noting that the effectiveness of the indicator may vary depending on the specific market and trading strategy. It is recommended to combine its analysis with other technical indicators and perform thorough backtesting before making trading decisions.
Key Features:
- 2 Adjustable EMAs
- Normalized Oscillator Mode
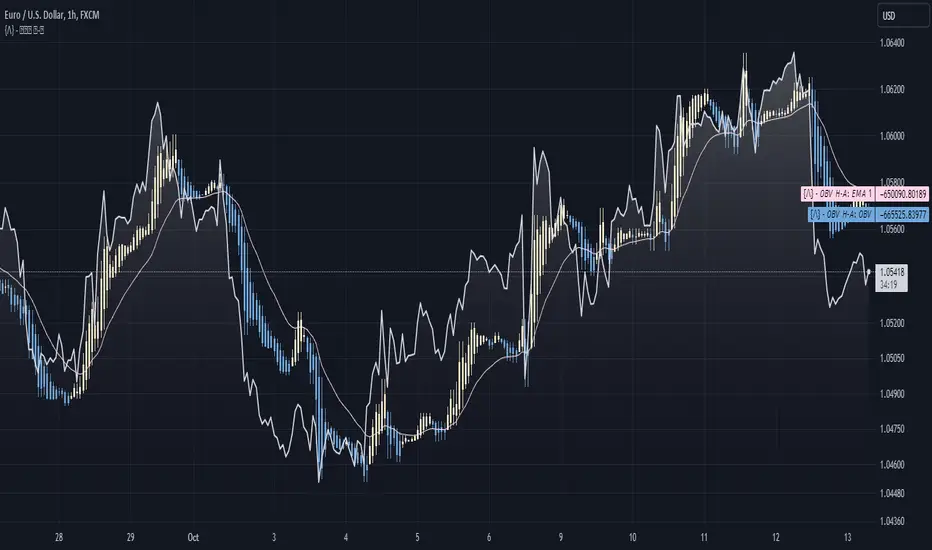
Example Charts:
See Also:
Z-Score Heikin-Ashi Transformed

Phát hành các Ghi chú
Updated licensePhát hành các Ghi chú
Improved code methodology.Phát hành các Ghi chú
improved methodology, added full support for plot export to new SuperTrend ToolKitMã nguồn mở
Theo tinh thần TradingView thực sự, tác giả của tập lệnh này đã xuất bản dưới dạng nguồn mở để các nhà giao dịch có thể hiểu và xác minh. Chúc mừng tác giả! Bạn có thể sử dụng miễn phí. Tuy nhiên, bạn cần sử dụng lại mã này theo Quy tắc nội bộ. Bạn có thể yêu thích nó để sử dụng nó trên biểu đồ.
Thông báo miễn trừ trách nhiệm
Thông tin và ấn phẩm không có nghĩa là và không cấu thành, tài chính, đầu tư, kinh doanh, hoặc các loại lời khuyên hoặc khuyến nghị khác được cung cấp hoặc xác nhận bởi TradingView. Đọc thêm trong Điều khoản sử dụng.