OPEN-SOURCE SCRIPT
Cập nhật RS Line - Relative Strength Line [LevelUp]
Overview:
This implementation of the RS Line mimics how Investor's Business Daily and CANSLIM investors measure growth stock performance versus the S&P 500.
If you are looking at a weekly chart, the RS Line is the performance of the stock over the past week versus the S&P 500 over that same time frame. The same logic applies to the daily and monthly charts, only the time frames are different.
If a stock moves up for the day/week/month and the S&P 500 does not, the RS Line will move up. If a stock ends the day/week/month flat, yet the S&P 500 moves up, the RS Line will go down.
Usage:
- Look for an upward sloping line.
- The steeper the line, the better.
- Can be used for viewing long-term trend.
Phát hành các Ghi chú
Colors for all of the RS Line variations can now be configured. Phát hành các Ghi chú
Version updates:
✓ Support for any index, defaults to S&P 500 (SPX).
✓ Default plot color now shows on both dark and light modes.
Phát hành các Ghi chú
v4 version updates:The max vertical offset on where to show the RS Line is now 200. This is necessary to accommodate scaling requirements for some indexes.
Phát hành các Ghi chú
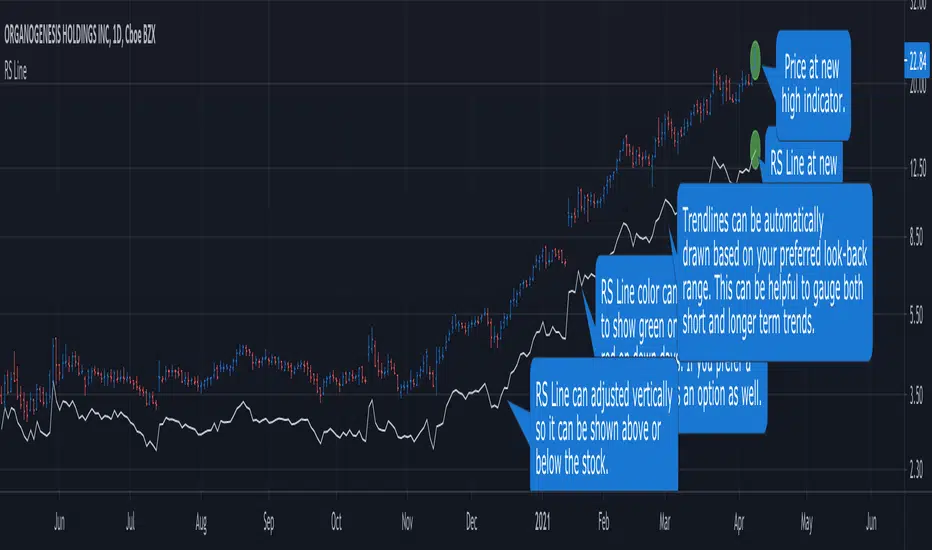
v5 version updates:One helpful tool when viewing an RS Line is to use a trendline, which can provide insight into the bigger picture performance of a stock versus the S&P 500. With this release of the RS Line you can now configure two trendlines that will be drawn for you, based on the criteria you specify.
The trendlines will be colored green or red based on the direction of the trend. You can also configure how far to look-back for each line, providing information for both short-term and long-term traders. For example, if you set a trendline look-back to 10, it will look back 10 days on a daily chart, 10 weeks on a weekly chart, etc
The configurable trendlines offer the following features:
■ Trendlines can be used on any timeframe
■ Trendlines are automatically colored based on the direction:
green for uptrend, red for downtrend
■ Plot up to two trendlines
■ Trendline width can be adjusted
■ Configurable look-back values
Two examples are shown below: APPL and CRSR
Phát hành các Ghi chú
v6 version updates:The following new features have been added:
■ Draw most recent high based on your preferred look-back range
■ Set color preferences for RS Line
Please leave a comment if you have suggestions on features you'd like to see.
More updates coming soon...
Phát hành các Ghi chú
v7 version updates:New features:
■ Visual callout to show RS Line at new high
■ Configurable callout shape and color
Phát hành các Ghi chú
v8 version updates:■ For an IPO, verify look-back date range.
Phát hành các Ghi chú
v9 version updates:■ Visual callout to show the RS Line at a new high before the price reaches a new high.
■ Visual callout to show the price at a new high.
Historical research of past big winners has shown that an RS Line at a new high before the price reaches a new high, may proceed a significant move up. This bullish signal is now much easier to identify.
Example #1 - Microsoft in 1986
Over approximately 8 months, MSFT was up over 200% before a decisive close below the 50-day SMA.
Example #2 - OKTA in 2020
A more recent example is OKTA. In just 5 months there was a 50% move up before closing below the 50-day SMA.
Phát hành các Ghi chú
v10 version updates:■ Added an option to show a configurable moving average of the RS Line.
Phát hành các Ghi chú
v11 version updates:■ Minor changes to default settings.
Phát hành các Ghi chú
v12 version updates:■ Add an option to show/hide RS Line recent high line.
■ Change order of various Settings for easier navigation.
Phát hành các Ghi chú
v13 version updates:Given the indicator supports any index to gauge relative performance, as more indexes were tested, it became clear a wider range of offset values for vertical placement was needed.
■ The vertical offset of the RS Line can be between 1 and 1500.
Phát hành các Ghi chú
v14 version updates:■ Update Settings dialog with section titles to make navigation easier.
■ RS Line only on daily, weekly and monthly charts as intraday skews the chart.
Phát hành các Ghi chú
v15 version updates:■ Optional moving average is now shown only on daily, weekly and monthly charts as intraday skews the chart.
Phát hành các Ghi chú
v16 version updates:■ Minor updates so the RS Line and related information are only shown on daily, weekly and monthly charts.
Phát hành các Ghi chú
v17 version updates:■ Changes to the Settings dialog to simplify the user interface.
■ RS Line is no longer displayed on futures or indexes as these charts can becomes skewed.
Phát hành các Ghi chú
Update the chart to show various features of the RS Line indicator.Phát hành các Ghi chú
v18■ Updates to layout and color configurations.
Phát hành các Ghi chú
v19■ Minor change to scaling of the chart.
Phát hành các Ghi chú
v20■ Updates to RS Line layout.
■ Customization of line colors and width.
■ Simplification of Settings dialog.
Phát hành các Ghi chú
v21■ Auto-generated trendline updates.
■ Specify timeframe(s) to show the RS Line.
Phát hành các Ghi chú
v22■ Updates to trendline calculations.
Phát hành các Ghi chú
v23■ RS Line and related data no longer shown for indexes and futures.
Phát hành các Ghi chú
v24■ Support for longer trendlines.
Mã nguồn mở
Theo đúng tinh thần TradingView, tác giả của tập lệnh này đã công bố nó dưới dạng mã nguồn mở, để các nhà giao dịch có thể xem xét và xác minh chức năng. Chúc mừng tác giả! Mặc dù bạn có thể sử dụng miễn phí, hãy nhớ rằng việc công bố lại mã phải tuân theo Nội quy.
Join traders in over 40 countries and LevelUp!
tradingview.com/spaces/LevelUpTools/
tradingview.com/spaces/LevelUpTools/
Thông báo miễn trừ trách nhiệm
Thông tin và các ấn phẩm này không nhằm mục đích, và không cấu thành, lời khuyên hoặc khuyến nghị về tài chính, đầu tư, giao dịch hay các loại khác do TradingView cung cấp hoặc xác nhận. Đọc thêm tại Điều khoản Sử dụng.