OPEN-SOURCE SCRIPT
Support and Resistance Levels
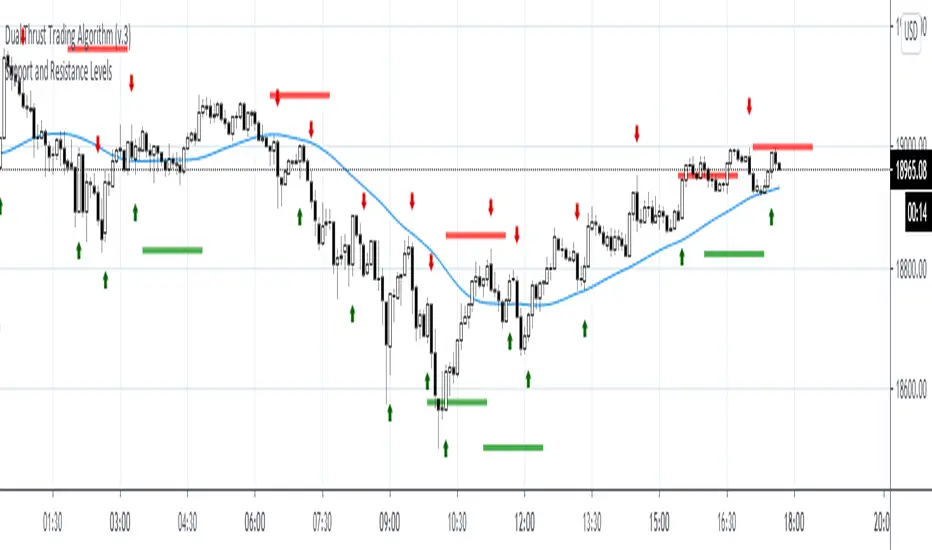
Detecting Support and Resistance Levels
Description:
Support & Resistance levels are essential for every trader to define the decision points of the markets. If you are long and the market falls below the previous support level, you most probably have got the wrong position and better exit.
This script uses the first and second deviation of a curve to find the turning points and extremes of the price curve.
The deviation of a curve is nothing else than the momentum of a curve (and inertia is another name for momentum). It defines the slope of the curve. If the slope of a curve is zero, you have found a local extreme. The curve will change from rising to falling or the other way round.
The second deviation, or the momentum of momentum, shows you the turning points of the first deviation. This is important, as at this point the original curve will switch from acceleration to break mode.
Using the logic laid out above the support&resistance indicator will show the turning points of the market in a timely manner. Depending on level of market-smoothing it will show the long term or short term turning points.
This script first calculates the first and second deviation of the smoothed market, and in a second step runs the turning point detection.
Style tags: Trend Following, Trend Analysis
Asset class: Equities, Futures, ETFs, Currencies and Commodities
Dataset: FX Minutes/Hours/Days
Mã nguồn mở
Theo đúng tinh thần TradingView, tác giả của tập lệnh này đã công bố nó dưới dạng mã nguồn mở, để các nhà giao dịch có thể xem xét và xác minh chức năng. Chúc mừng tác giả! Mặc dù bạn có thể sử dụng miễn phí, hãy nhớ rằng việc công bố lại mã phải tuân theo Nội quy.
Thông báo miễn trừ trách nhiệm
Thông tin và các ấn phẩm này không nhằm mục đích, và không cấu thành, lời khuyên hoặc khuyến nghị về tài chính, đầu tư, giao dịch hay các loại khác do TradingView cung cấp hoặc xác nhận. Đọc thêm tại Điều khoản Sử dụng.