OPEN-SOURCE SCRIPT
Cập nhật Pinks MultiRSI
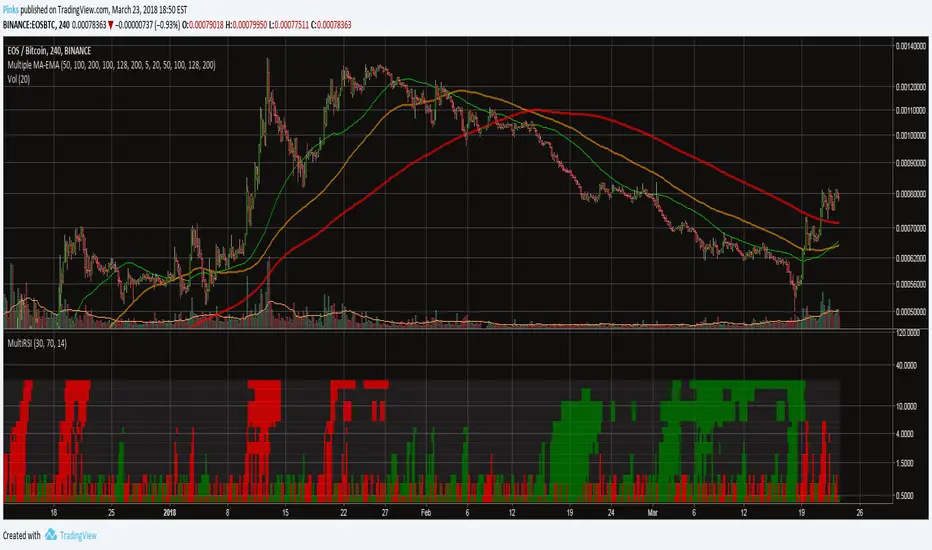
An indicator that displays whether RSI is oversold, undersold, or neutral, on several timeframes:
15m, 30m, 45m, 1h, 2h, 3h, 4h, 5h, 6h, 12h, 18h, 1D.
If RSI for a specific interval is overbought, the bars for that interval turn red (for "sell"). If it is oversold, it turns green (for "buy"). The RSI length, oversold level, and overbought level are tuneable.
The bottom row of coloumns is 15m RSI, top row is 1D RSI. It is recommended to use log scale on this indicator. The bar height is proportional to the interval it cover.
Phát hành các Ghi chú
**NEW FEATURES**/b]You can now set multiple levels of overbought and oversold! The columns will be colored according to how oversold or overbought the RSI is. This will help you get a clearer image of the RSI on all timeframes.
Phát hành các Ghi chú
Fixed bug where 5h RSI was set to 4h.Phát hành các Ghi chú
Changed chart imageMã nguồn mở
Theo đúng tinh thần TradingView, tác giả của tập lệnh này đã công bố nó dưới dạng mã nguồn mở, để các nhà giao dịch có thể xem xét và xác minh chức năng. Chúc mừng tác giả! Mặc dù bạn có thể sử dụng miễn phí, hãy nhớ rằng việc công bố lại mã phải tuân theo Nội quy.
Thông báo miễn trừ trách nhiệm
Thông tin và các ấn phẩm này không nhằm mục đích, và không cấu thành, lời khuyên hoặc khuyến nghị về tài chính, đầu tư, giao dịch hay các loại khác do TradingView cung cấp hoặc xác nhận. Đọc thêm tại Điều khoản Sử dụng.
Mã nguồn mở
Theo đúng tinh thần TradingView, tác giả của tập lệnh này đã công bố nó dưới dạng mã nguồn mở, để các nhà giao dịch có thể xem xét và xác minh chức năng. Chúc mừng tác giả! Mặc dù bạn có thể sử dụng miễn phí, hãy nhớ rằng việc công bố lại mã phải tuân theo Nội quy.
Thông báo miễn trừ trách nhiệm
Thông tin và các ấn phẩm này không nhằm mục đích, và không cấu thành, lời khuyên hoặc khuyến nghị về tài chính, đầu tư, giao dịch hay các loại khác do TradingView cung cấp hoặc xác nhận. Đọc thêm tại Điều khoản Sử dụng.