OPEN-SOURCE SCRIPT
APEX - RSI with MA [v1]
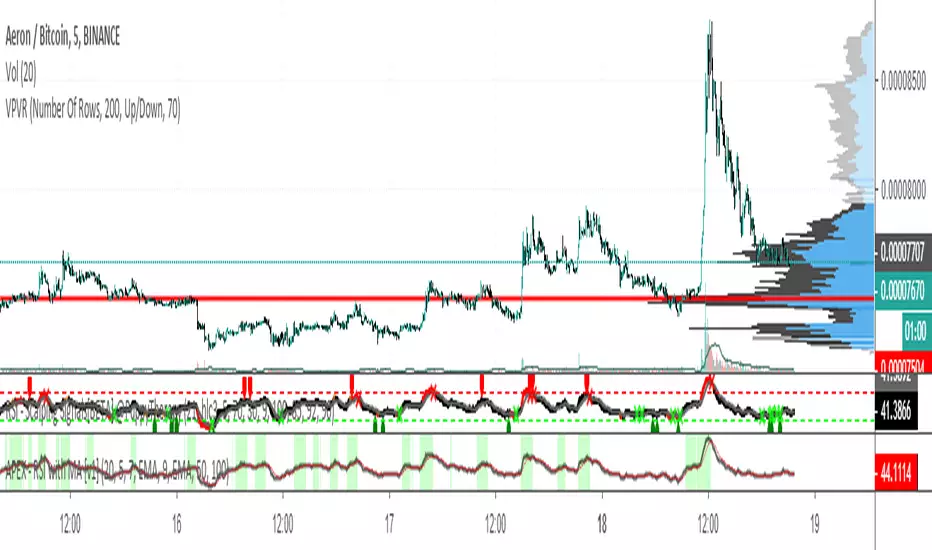
The Relative Strength Index (RSI) is as a momentum oscillator originally developed by J. Welles Wilder. The indicator is calculated as a Ratio of higher closes to lower closes on a scale of 0 to 100.
If the indicator reaches values above 80 (some use 70 or 75) it means the instrument is overbought and if the values are below 20 (25 or 30) it is oversold. But be aware those are just terms oversold/overbought main oversold /overbought for a long time. In general values over 50 mean your instrument is in a bullish state and below 50 it is in a bearish state.
The indicator is most commonly used with the length of 14. Some use RSI in a much more aggressive manner with the length of 2 (also known as Connors RSI). Whereas others have used length up to 20.
Use greater length values on the lower the timeframe to help with the noise. On larger time frames, you should be looking at lower length values.
Mã nguồn mở
Theo đúng tinh thần TradingView, tác giả của tập lệnh này đã công bố nó dưới dạng mã nguồn mở, để các nhà giao dịch có thể xem xét và xác minh chức năng. Chúc mừng tác giả! Mặc dù bạn có thể sử dụng miễn phí, hãy nhớ rằng việc công bố lại mã phải tuân theo Nội quy.
Thông báo miễn trừ trách nhiệm
Thông tin và các ấn phẩm này không nhằm mục đích, và không cấu thành, lời khuyên hoặc khuyến nghị về tài chính, đầu tư, giao dịch hay các loại khác do TradingView cung cấp hoặc xác nhận. Đọc thêm tại Điều khoản Sử dụng.