OPEN-SOURCE SCRIPT
Cập nhật Multi Timeframe Bull Market Support Bands
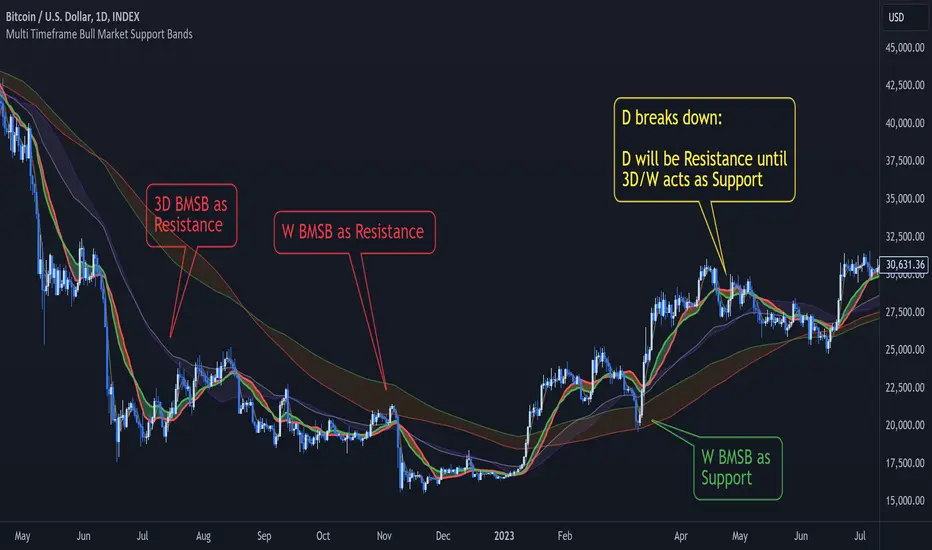
Multi Timeframe Bull Market Support Bands (BMSB) Indicator
Concept and Functionality:
The Multi Timeframe Bull Market Support Bands (BMSB) indicator is a powerful tool designed to identify and visualize support levels across multiple timeframes simultaneously. The primary concept behind BMSB is to plot dynamic support bands derived from moving averages (MAs) that adapt to the prevailing bullish conditions across different timeframes. These bands act as support and resistance (S/R) levels, providing traders with critical insights into potential price bounce areas and market direction.
Key Features:
Benefits:
- Enhanced Market Insight: By layering support bands from multiple timeframes, traders gain a comprehensive view of market dynamics and potential bounce areas.
- Improved Decision-Making: The ability to see upcoming support bands and how the price interacts with them aids in making more informed trading decisions.
- Customization and Flexibility: Adjustable moving average periods ensure that the indicator can be tailored to fit various trading strategies and market conditions.
The Multi Timeframe Bull Market Support Bands indicator is a versatile and insightful tool for traders aiming to leverage multi-timeframe analysis to enhance their trading strategies and better understand market behavior.
Concept and Functionality:
The Multi Timeframe Bull Market Support Bands (BMSB) indicator is a powerful tool designed to identify and visualize support levels across multiple timeframes simultaneously. The primary concept behind BMSB is to plot dynamic support bands derived from moving averages (MAs) that adapt to the prevailing bullish conditions across different timeframes. These bands act as support and resistance (S/R) levels, providing traders with critical insights into potential price bounce areas and market direction.
Key Features:
- Multi Timeframe Analysis:
- The indicator plots bull market support bands for the following timeframes concurrently: Chart (with price prediction), 5 minutes (5m), 15 minutes (15m), 1 hour (1h or 60), 4 hours (4h or 240), Daily (D), 3 Days (3D), and Weekly (W).
- These bands allow traders to see how the price interacts with different support levels, potentially bouncing between them as it moves across timeframes. - Dynamic Band Visibility:
- Bands from shorter timeframes are only displayed in relevant higher timeframes:
- 5m is shown only in timeframes ≤ 15m.
- 15m is shown only in timeframes ≤ 1h.
- 1h is shown only in timeframes ≤ 4h.
- 4h is shown only in timeframes ≤ D.
- D and 3D are shown only in timeframes ≤ W.
- W is always shown. - Customizable Moving Averages:
- The period of the moving averages used to calculate the support bands can be adjusted. Any changes made will be applied across all bands to maintain consistency. - Future Band Prediction:
- If the current timeframe lacks sufficient bars to calculate a moving average, the indicator shows a blue line on the bar where the band will appear. When a new band appears on the current bar, it is highlighted in purple, allowing traders to notice the first value of the new band.
- These new bands can act as magnets, attracting price action. Knowing when a new band will appear helps traders anticipate whether the price will be drawn to the upcoming band or potentially break through it.
Benefits:
- Enhanced Market Insight: By layering support bands from multiple timeframes, traders gain a comprehensive view of market dynamics and potential bounce areas.
- Improved Decision-Making: The ability to see upcoming support bands and how the price interacts with them aids in making more informed trading decisions.
- Customization and Flexibility: Adjustable moving average periods ensure that the indicator can be tailored to fit various trading strategies and market conditions.
The Multi Timeframe Bull Market Support Bands indicator is a versatile and insightful tool for traders aiming to leverage multi-timeframe analysis to enhance their trading strategies and better understand market behavior.
Phát hành các Ghi chú
Add labels with the timeframe of each band.Mã nguồn mở
Theo đúng tinh thần TradingView, tác giả của tập lệnh này đã công bố nó dưới dạng mã nguồn mở, để các nhà giao dịch có thể xem xét và xác minh chức năng. Chúc mừng tác giả! Mặc dù bạn có thể sử dụng miễn phí, hãy nhớ rằng việc công bố lại mã phải tuân theo Nội quy.
Thông báo miễn trừ trách nhiệm
Thông tin và các ấn phẩm này không nhằm mục đích, và không cấu thành, lời khuyên hoặc khuyến nghị về tài chính, đầu tư, giao dịch hay các loại khác do TradingView cung cấp hoặc xác nhận. Đọc thêm tại Điều khoản Sử dụng.
Mã nguồn mở
Theo đúng tinh thần TradingView, tác giả của tập lệnh này đã công bố nó dưới dạng mã nguồn mở, để các nhà giao dịch có thể xem xét và xác minh chức năng. Chúc mừng tác giả! Mặc dù bạn có thể sử dụng miễn phí, hãy nhớ rằng việc công bố lại mã phải tuân theo Nội quy.
Thông báo miễn trừ trách nhiệm
Thông tin và các ấn phẩm này không nhằm mục đích, và không cấu thành, lời khuyên hoặc khuyến nghị về tài chính, đầu tư, giao dịch hay các loại khác do TradingView cung cấp hoặc xác nhận. Đọc thêm tại Điều khoản Sử dụng.