OPEN-SOURCE SCRIPT
Cập nhật Trappin Previous Timeframe Levels
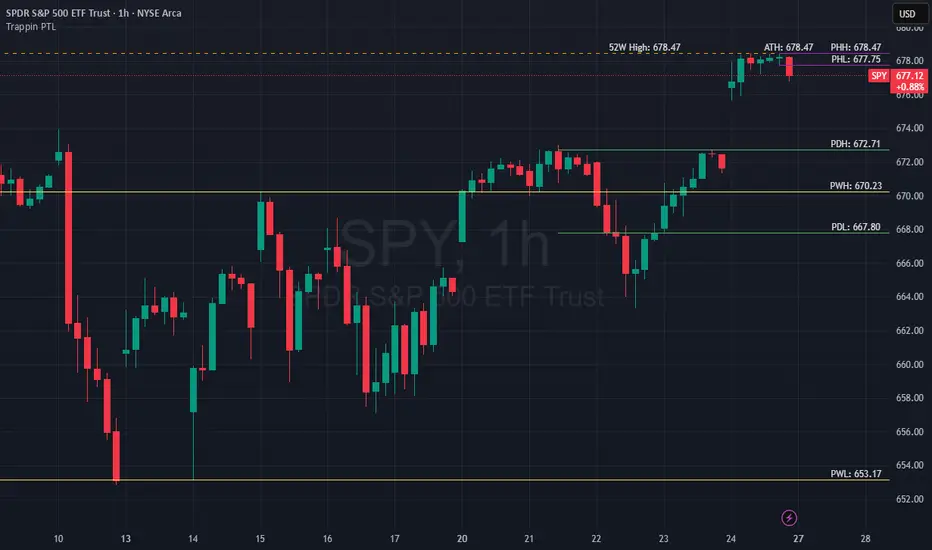
Trappin Previous Timeframe Levels (Trappin PTL)
Overview
Trappin PTL is a comprehensive multi-timeframe support and resistance indicator that displays key price levels from multiple timeframes on a single chart. This indicator helps traders identify critical price zones where reversals or breakouts are likely to occur, making it ideal for both intraday and swing trading strategies.
💡 Origin Story
I got tired of manually drawing these lines that I learned from watching Wallstreet Trapper on Trappin Tuesdays YouTube live streams. After repeatedly marking the same previous timeframe levels on every chart, I decided to automate the process. Hope it helps you as much as it helps me!
Key Features
📊 Multiple Timeframe Levels
The indicator tracks and displays high/low levels from:
🎨 Fully Customizable
Why "Trappin"?
The name is a tribute to Wallstreet Trapper and his Trappin Tuesdays YouTube live streams, where I learned the importance of marking previous timeframe levels. The name also reflects the indicator's purpose: identifying price levels where traders often get "trapped" - whether it's bulls getting trapped below resistance or bears getting trapped above support. These levels represent zones where significant order flow and liquidity exist, making them prime areas for reversals or breakouts.
Credits
Created by resoh
Inspired by Wallstreet Trapper and Trappin Tuesdays YouTube live streams
This indicator is provided for educational and informational purposes. Always practice proper risk management and conduct your own analysis before making trading decisions.
Version History
v1.0 - Initial Release
Overview
Trappin PTL is a comprehensive multi-timeframe support and resistance indicator that displays key price levels from multiple timeframes on a single chart. This indicator helps traders identify critical price zones where reversals or breakouts are likely to occur, making it ideal for both intraday and swing trading strategies.
💡 Origin Story
I got tired of manually drawing these lines that I learned from watching Wallstreet Trapper on Trappin Tuesdays YouTube live streams. After repeatedly marking the same previous timeframe levels on every chart, I decided to automate the process. Hope it helps you as much as it helps me!
Key Features
📊 Multiple Timeframe Levels
The indicator tracks and displays high/low levels from:
- Previous Hour (PHH/PHL) - Purple lines
- Previous Day (PDH/PDL) - Green lines
- Previous Week (PWH/PWL) - Yellow lines
- Previous Month (PMH/PML) - Blue lines
- All-Time High (ATH) - Red line
- 52-Week High - Orange line
🎨 Fully Customizable
- Colors - Change the color of each timeframe independently
- Line Styles - Choose between Solid, Dashed, or Dotted lines
- Line Widths - Adjust thickness from 1-4 pixels
- All settings organized in intuitive groups for easy access
- Lines extend back to show when the level was established
- Lines project forward to show current relevance
- Historical context helps identify key support/resistance zones
- Each level displays its exact price value (no currency symbols)
- Labels positioned horizontally to avoid overlap
- Adaptive text color for visibility on any chart theme (dark or light mode)
Why "Trappin"?
The name is a tribute to Wallstreet Trapper and his Trappin Tuesdays YouTube live streams, where I learned the importance of marking previous timeframe levels. The name also reflects the indicator's purpose: identifying price levels where traders often get "trapped" - whether it's bulls getting trapped below resistance or bears getting trapped above support. These levels represent zones where significant order flow and liquidity exist, making them prime areas for reversals or breakouts.
Credits
Created by resoh
Inspired by Wallstreet Trapper and Trappin Tuesdays YouTube live streams
This indicator is provided for educational and informational purposes. Always practice proper risk management and conduct your own analysis before making trading decisions.
Version History
v1.0 - Initial Release
- Multi-timeframe high/low levels
- All-time high tracking
- 52-week high tracking
- Fully customizable colors, styles, and widths
- Adaptive labels with price display
- Smart line extension showing historical context
Phát hành các Ghi chú
Trappin Previous Timeframe Levels (Trappin PTL)Overview
Trappin PTL is a comprehensive multi-timeframe support and resistance indicator that displays key price levels from multiple timeframes on a single chart. This indicator helps traders identify critical price zones where reversals or breakouts are likely to occur, making it ideal for both intraday and swing trading strategies.
💡 Origin Story
I got tired of manually drawing these lines that I learned from watching Wallstreet Trapper on Trappin Tuesdays YouTube live streams. After repeatedly marking the same previous timeframe levels on every chart, I decided to automate the process. Hope it helps you as much as it helps me!
Key Features
📊 Multiple Timeframe Levels
The indicator tracks and displays high/low levels from:
Previous Hour (PHH/PHL) - Purple lines
Previous Day (PDH/PDL) - Green lines
Previous Week (PWH/PWL) - Yellow lines
Previous Month (PMH/PML) - Blue lines
All-Time High (ATH) - Red line
52-Week High - Orange line
🎨 Fully Customizable
Visibility Toggles - Show/hide each individual line and label independently
Colors - Change the color of each timeframe independently
Line Styles - Choose between Solid, Dashed, or Dotted lines
Line Widths - Adjust thickness from 1-4 pixels
All settings organized in intuitive groups for easy access
📍 Smart Line Extension
Lines extend back to show when the level was established
Lines project forward to show current relevance
Historical context helps identify key support/resistance zones
🏷️ Clear Price Labels
Each level displays its exact price value (no currency symbols)
Labels positioned horizontally to avoid overlap
Adaptive text color for visibility on any chart theme (dark or light mode)
Installation & Setup
1. Add the indicator to your chart
2. Customize colors, styles, and widths to your preference
3. Toggle visibility of individual levels as needed
4. (Optional) Adjust visual order to display lines in front of bars:
- Right-click on "Trappin PTL" in the indicator list on your chart
- Select "Visual Order" or "Bring to Front"
- Move the indicator above the main chart series
Why "Trappin"?
The name is a tribute to Wallstreet Trapper and his Trappin Tuesdays YouTube live streams, where I learned the importance of marking previous timeframe levels. The name also reflects the indicator's purpose: identifying price levels where traders often get "trapped" - whether it's bulls getting trapped below resistance or bears getting trapped above support. These levels represent zones where significant order flow and liquidity exist, making them prime areas for reversals or breakouts.
Credits
Created by resoh
Inspired by Wallstreet Trapper and Trappin Tuesdays YouTube live streams
This indicator is provided for educational and informational purposes. Always practice proper risk management and conduct your own analysis before making trading decisions.
Version History
v1.1 - Visibility Controls Update
- Added individual visibility toggles for each line and label
- 10 independent show/hide controls in new "Visibility" settings group
- Cleaner chart customization - display only the levels you need
- All toggles enabled by default for backward compatibility
v1.0 - Initial Release
- Multi-timeframe high/low levels
- All-time high tracking
- 52-week high tracking
- Fully customizable colors, styles, and widths
- Adaptive labels with price display
- Smart line extension showing historical context
Mã nguồn mở
Theo đúng tinh thần TradingView, tác giả của tập lệnh này đã công bố nó dưới dạng mã nguồn mở, để các nhà giao dịch có thể xem xét và xác minh chức năng. Chúc mừng tác giả! Mặc dù bạn có thể sử dụng miễn phí, hãy nhớ rằng việc công bố lại mã phải tuân theo Nội quy.
Thông báo miễn trừ trách nhiệm
Thông tin và các ấn phẩm này không nhằm mục đích, và không cấu thành, lời khuyên hoặc khuyến nghị về tài chính, đầu tư, giao dịch hay các loại khác do TradingView cung cấp hoặc xác nhận. Đọc thêm tại Điều khoản Sử dụng.