OPEN-SOURCE SCRIPT
Sine Wave
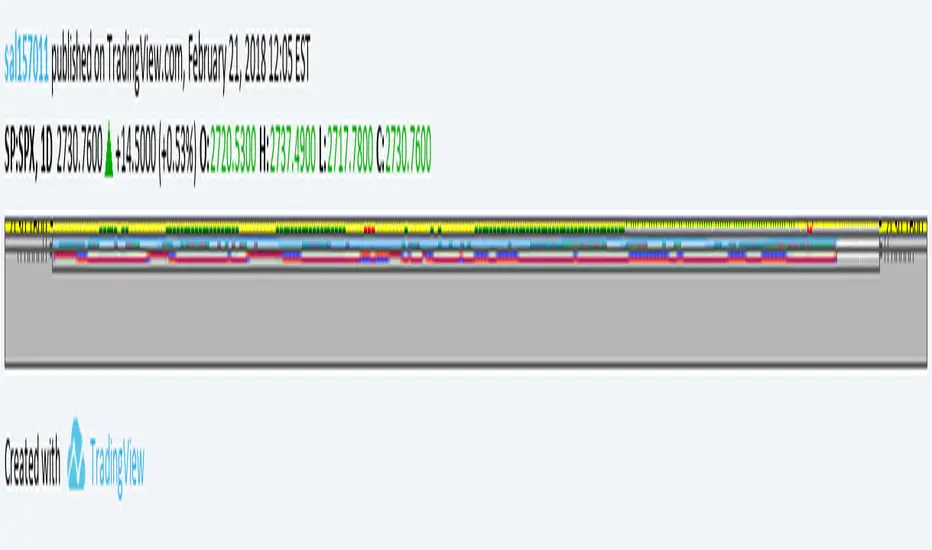
This is John F. Ehlers, Hilbert Sine Wave with barcolor and bgcolor.
When fast line red crosses down slow line blue that is a zone of resistance in the price chart, and when fast line crosses up slow line blue that is a zone of support.
When close of the bar is equal or greater than the zone of resistance there is a trend up mode in place and trending instruments like Hull moving average should be used, and when the close of the bar is equal or greater than the zone of resistance there is a trend down in place and trending instruments should be used too.
When none of the preceeding conditions are valid there is a cycle mode, and cycle instruments like oscillators, stochastics and the Sine Wave itself should be used. Note that the Sine Wave is almost always a leading indicator when in a cycle mode.
Barcolor and bgcolor mean: Green = Trend Up , Red = Trend Down, Yellow= Cycle mode
Mã nguồn mở
Theo đúng tinh thần TradingView, tác giả của tập lệnh này đã công bố nó dưới dạng mã nguồn mở, để các nhà giao dịch có thể xem xét và xác minh chức năng. Chúc mừng tác giả! Mặc dù bạn có thể sử dụng miễn phí, hãy nhớ rằng việc công bố lại mã phải tuân theo Nội quy.
Thông báo miễn trừ trách nhiệm
Thông tin và các ấn phẩm này không nhằm mục đích, và không cấu thành, lời khuyên hoặc khuyến nghị về tài chính, đầu tư, giao dịch hay các loại khác do TradingView cung cấp hoặc xác nhận. Đọc thêm tại Điều khoản Sử dụng.