OPEN-SOURCE SCRIPT
UB Profit Signal Indicator
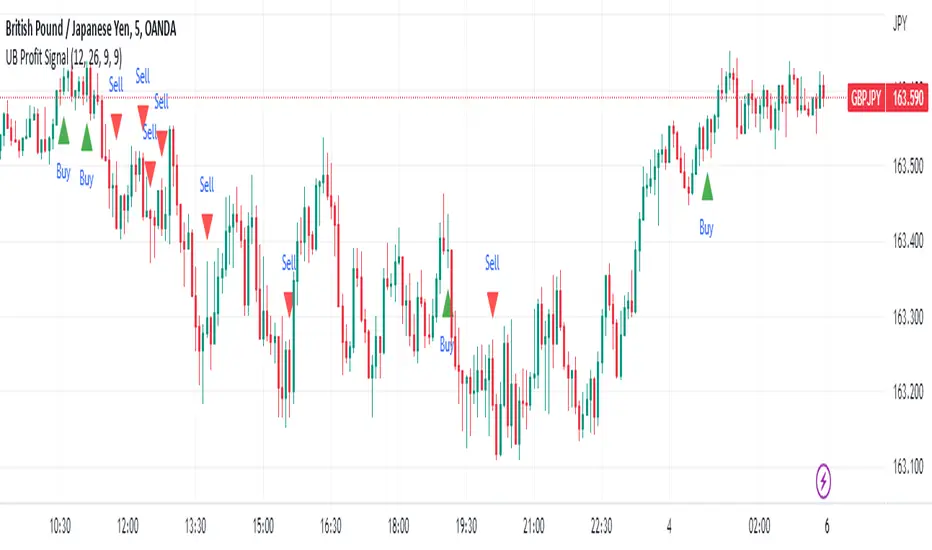
The UB Profit Signal indicator is a technical analysis tool designed to identify potential buy and sell signals in the market. The indicator is based on four technical indicators - Moving Average Convergence Divergence (MACD), Relative Strength Index (RSI), Bollinger Bands (BB), and volume moving average.
The script starts by defining input variables such as MACD Fast Length, MACD Slow Length, MACD Signal Length, RSI Length, etc. These variables are used to customize the indicator based on the user's preference.
The MACD is calculated using the ta.macd function, which returns three variables: the MACD Line, Signal Line, and Histogram. The MACD line is calculated as the difference between two exponential moving averages of the price. The signal line is a moving average of the MACD line. The histogram shows the difference between the MACD line and the signal line.
The RSI is calculated using the ta.rsi function, which calculates the RSI value based on the number of periods specified in the RSI Length input variable. The RSI is a momentum oscillator that measures the speed and change of price movements.
The Bollinger Bands are calculated using the ta.sma and ta.stdev functions. The Simple Moving Average (SMA) is calculated using the close price over 21 periods, while the Standard Deviation is calculated using the close price over the same 21 periods. The upper and lower bands are then calculated based on the SMA and Standard Deviation.
Finally, the buy and sell signals are generated based on specific conditions that combine the MACD, RSI, and BB values. For example, a buy signal is generated when the RSI value is greater than 30, the volume is greater than the volume moving average, the close price is greater than the 9-period SMA, and the close price is between the upper and lower BBs. Similarly, a sell signal is generated when the RSI value is less than 40, the volume is greater than the volume moving average, the close price is less than the 9-period SMA, and the close price is between the upper and lower BBs.
The buy and sell signals are plotted on the chart using the plotshape function, which creates triangular shapes above and below the bars to indicate the signals. Green triangles indicate a buy signal, while red triangles indicate a sell signal. Overall, the UB Profit Signal indicator can be useful for traders looking to identify potential buy and sell signals in the market and take advantage of price movements.
Mã nguồn mở
Theo đúng tinh thần TradingView, tác giả của tập lệnh này đã công bố nó dưới dạng mã nguồn mở, để các nhà giao dịch có thể xem xét và xác minh chức năng. Chúc mừng tác giả! Mặc dù bạn có thể sử dụng miễn phí, hãy nhớ rằng việc công bố lại mã phải tuân theo Nội quy.
Thông báo miễn trừ trách nhiệm
Thông tin và các ấn phẩm này không nhằm mục đích, và không cấu thành, lời khuyên hoặc khuyến nghị về tài chính, đầu tư, giao dịch hay các loại khác do TradingView cung cấp hoặc xác nhận. Đọc thêm tại Điều khoản Sử dụng.