|Magical Trend Line with RSI & ADX|
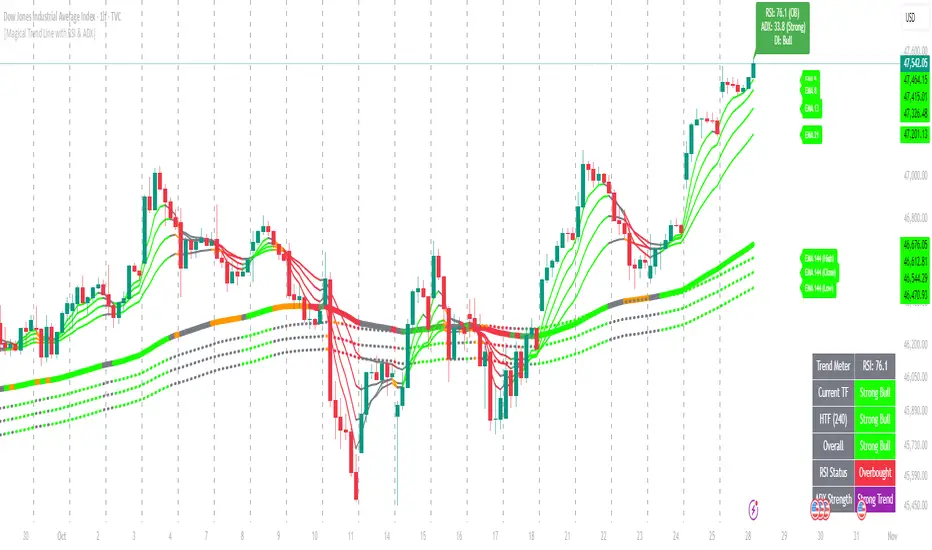
### Adaptive Multi-Layer Trend Analyzer with EMA Structure, RSI Momentum, ADX Strength & Table Dashboard
**Version:** 1.0 | **Language:** Pine Script v6 | **Author:** ask2maniish
---
## 🔍 Summary of the Script
This indicator combines **EMA trend structure**, **RSI**, and **ADX** to form a **multi-layered trend confirmation system** with rich visual cues and a live table dashboard.
---
## 🧭 1. Trend Direction System
Uses **EMA Fast**, **EMA Slow**, and **Main EMA (default 100-period)** to detect the current trend structure.
Classifies trends into 5 categories:
| Trend Type | Color | Description |
|-------------|--------|-------------|
| 🟢 Bright Green | Strong Bullish | Strong upside with momentum |
| 🟩 Green | Moderate Bullish | Controlled upward structure |
| ⚪ Gray | Sideways / Neutral | Low momentum or indecision |
| 🟧 Orange | Moderate Bearish | Controlled decline |
| 🔴 Red | Strong Bearish | Aggressive downward pressure |
---
## ⚙️ 2. RSI + ADX Momentum Filter
**RSI** detects momentum direction and exhaustion:
- RSI > 70 → Overbought (Potential reversal)
- RSI < 30 → Oversold (Potential reversal)
- RSI rising above 50 → Bullish momentum
- RSI falling below 50 → Bearish momentum
**ADX** identifies trend strength:
- ADX > 25 → Strong trend
- ADX < 25 → Weak / ranging market
✅ **Combined Logic:**
RSI defines direction, ADX confirms strength.
When both align with EMA structure, trend continuation probability increases.
---
## 📈 3. Multiple EMA Layers (7 Total)
Optionally visualize up to **7 EMAs (5, 8, 13, 21, 144-high, 144-close, 144-low)**.
Each EMA auto-colors using localized slope and RSI/ADX confluence logic.
Gives a clear view of **momentum stacking** and **trend maturity**.
---
## 📊 4. Trend Meter Table (HTF + LTF View)
A dynamic table provides both **current timeframe (LTF)** and **higher timeframe (HTF)** trend confirmation.
| Table Section | Description |
|----------------|-------------|
| **Current TF Trend** | EMA-based directional bias |
| **HTF Trend** | Optional higher timeframe confirmation |
| **RSI Status** | Momentum context |
| **ADX Strength** | Trend power |
| **Overall Bias** | Combined directional strength |
🧩 Example:
- ✅ Both LTF & HTF show Bullish → focus on longs.
- ❌ Both Bearish → focus on shorts.
- ⚪ Mixed → stand aside or scalp.
---
## 🎨 5. Background & Label System
- **Soft background shading** → shows live market bias.
- **On-chart labels** → display EMA trend, RSI/ADX values, and crossover events.
- **Color-coded EMA bands** → provide instant visual context.
---
## 🎯 How to Trade Using This Indicator
### 1️⃣ Identify Overall Market Context
Use the **Trend Meter Table** for directional bias.
- ✅ Bullish on both TFs → Focus on long setups.
- ❌ Bearish on both TFs → Focus on short setups.
- ⚪ Mixed signals → Wait for clarity or scalp only.
---
### 2️⃣ Entry Logic
**Long Setup**
- Main EMA color = 🟢 Green or Bright Green
- RSI rising above 50 (not yet overbought)
- ADX > threshold (e.g., 25)
- Price above both Fast & Slow EMA
**Short Setup**
- Main EMA color = 🟧 Orange or 🔴 Red
- RSI below 50 (not yet oversold)
- ADX > threshold
- Price below both Fast & Slow EMA
---
### 3️⃣ Exit / Reversal
- RSI enters overbought/oversold zone → take profit or tighten stop.
- Trend label shifts from “Strong” to “Moderate” → trend weakening.
- Candle closes below/above EMA cluster → exit signal.
---
### 4️⃣ Multi-Timeframe Confirmation
Always trade in the direction of **HTF bias**.
Example:
📍 On 15m → Confirm with 4H trend.
If 4H = “Strong Bullish”, only take long entries when local (15m) = bullish.
---
## ⚡ Tips
- Use with Smart Money Concepts or liquidity tools for added confluence.
- Works well for swing, intraday, and positional setups.
- Adjust RSI/ADX thresholds to match volatility regime.
---
## 📘 Disclaimer
This indicator is for **educational purposes** only and does not constitute financial advice.
Trade responsibly and use risk management at all times.
---
**© 2025 ask2maniish | Magical Trend Line with RSI & ADX**
Tập lệnh chỉ hiển thị cho người được mời
Chỉ những người dùng được tác giả đồng ý mới có thể truy cập tập lệnh này. Bạn cần yêu cầu và xin phép sử dụng tập lệnh này. Quyền truy cập thường được cấp sau khi thanh toán. Để biết thêm chi tiết, hãy làm theo hướng dẫn của tác giả bên dưới hoặc liên hệ trực tiếp với ask2maniish.
TradingView KHÔNG khuyến khích trả tiền hoặc sử dụng tập lệnh trừ khi bạn hoàn toàn tin tưởng tác giả và hiểu cách hoạt động của tập lệnh. Bạn cũng có thể tìm thấy các giải pháp thay thế miễn phí, mã nguồn mở trong mục tập lệnh cộng đồng của chúng tôi.
Hướng dẫn của tác giả
Thông báo miễn trừ trách nhiệm
Tập lệnh chỉ hiển thị cho người được mời
Chỉ những người dùng được tác giả đồng ý mới có thể truy cập tập lệnh này. Bạn cần yêu cầu và xin phép sử dụng tập lệnh này. Quyền truy cập thường được cấp sau khi thanh toán. Để biết thêm chi tiết, hãy làm theo hướng dẫn của tác giả bên dưới hoặc liên hệ trực tiếp với ask2maniish.
TradingView KHÔNG khuyến khích trả tiền hoặc sử dụng tập lệnh trừ khi bạn hoàn toàn tin tưởng tác giả và hiểu cách hoạt động của tập lệnh. Bạn cũng có thể tìm thấy các giải pháp thay thế miễn phí, mã nguồn mở trong mục tập lệnh cộng đồng của chúng tôi.