OPEN-SOURCE SCRIPT
Comparaison DXY, VIX, SPX, DJI, GVZ
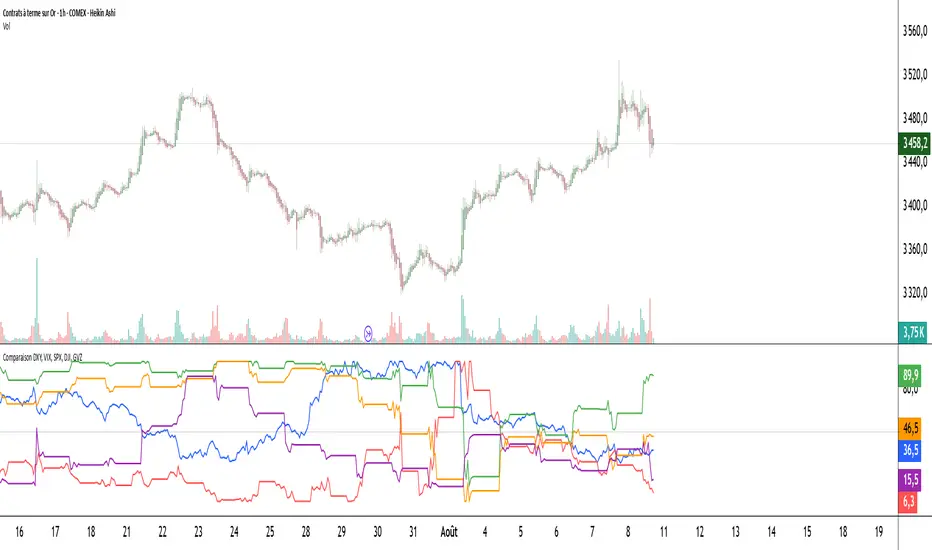
Pine Script indicator compares the normalized values of DXY, VIX, SPX, DJI, and GVZ indices on a single scale from 0 to 100. Here's a breakdown of what it does:
Data Requests: Gets closing prices for:
US Dollar Index (DXY)
VIX Volatility Index
S&P 500 (SPX)
Dow Jones Industrial Average (DJI)
Gold Volatility Index (GVZ)
Normalization: Each index is normalized using a 500-period lookback to scale values between 0-100, making them comparable despite different price scales.
Visualization:
Plots each normalized index with distinct colors
Adds a dotted midline at 50 for reference
Uses thicker linewidth (2) for better visibility
Timeframe Flexibility: Works on any chart timeframe since it uses timeframe.period
This is useful for:
Comparing relative strength/weakness between these key market indicators
Identifying divergences or convergences in their movements
Seeing how different asset classes (currencies, equities, volatility) relate
You could enhance this by:
Adding correlation calculations between pairs
Including options to adjust the normalization period
Adding alerts when instruments diverge beyond certain thresholds
Including volume or other metrics alongside price
Mã nguồn mở
Theo đúng tinh thần TradingView, tác giả của tập lệnh này đã công bố nó dưới dạng mã nguồn mở, để các nhà giao dịch có thể xem xét và xác minh chức năng. Chúc mừng tác giả! Mặc dù bạn có thể sử dụng miễn phí, hãy nhớ rằng việc công bố lại mã phải tuân theo Nội quy.
Thông báo miễn trừ trách nhiệm
Thông tin và các ấn phẩm này không nhằm mục đích, và không cấu thành, lời khuyên hoặc khuyến nghị về tài chính, đầu tư, giao dịch hay các loại khác do TradingView cung cấp hoặc xác nhận. Đọc thêm tại Điều khoản Sử dụng.