OPEN-SOURCE SCRIPT
Stock Relative Strength Power Index
As always, this is not financial advice and use at your own risk. Trading is risky and can cost you significant sums of money if you are not careful. Make sure you always have a proper entry and exit plan that includes defining your risk before you enter a trade.
This idea recently came out of some discussions I stumbled across in a trading group I am a part of regarding Relative Strength and Relative Weakness (shortened to RS and RW from here on out). The whole mechanism behind this trading system is to filter out underperforming securities relative to the current market direction to be in only the strongest or weakest stocks when the market is currently experiencing a bullish or bearish cycle. The idea behind this is there is no point in parking your money into a stock that is treading water or even going down if the market is making strong moves upwards. At that point, you are at worst losing money, and at best trading equal to the index/ETF, in which case the argument is why are you not just trading the index/ETF instead? RS or RW will filter out these sector laggards and allow you to position yourself into strong (or the strongest) stocks at any given time to help improve portfolio performance. Further, not only does it protect your position should the market shift against you briefly, it also often sees exceptional performance in the same cycle. For example, if SPY makes a 5% move over the course of a month, a stock with RS/RW may make a 10% move, or more, allowing you to see increased profit potential.
RS/RW is based on the idea of performance, that is the raw percent change of a security over a given time period relative to a benchmark. This benchmark is often the S&P500 (ES/SPX/SPY and their derivatives). I have to stress that this is not beta, which measures the volatility of a stock over a given period (i.e. ifSPY moves $1,  NVDA will often move $1.74). This is a measurement of the market (i.e. SPY) has moved 1% over the course of a day, NVDA has moved 8% over the course of the day. This is very often used as a signal of institutional interest as apart from some very unique moments, retail traders cannot and will not provide enough market pressure to move a market outside of a stock's normal trading range, nor will they outperform the sector or market as a whole consistently over time without some big money to make them move. The problem with running strict performance analysis (i.e. % change from period T ago to period T + n at present) is that while it gives us a baseline of how much the stock has moved, it doesn't overall mean much. For instance, if a $100 stock has moved 5% today, but has been experiencing a period of increased volatility and it's Average True Range (ATR) (the amount a stock will move over X number of periods, on average) is $7, performance seems impressive but is actually generally fairly weak to what the stock has been doing recently. Conversely, if we take a second stock, this time worth $20, and it too has moved 5% in one day but has an ATR of only $0.25, that stock has made an exceptional move and we want to be part of that.
Here, I have created an indicator called the Stock Relative Strength Power Index. This takes the stock's rate of change (ROC) (the % move it has made over X number of periods), the stock's normalized ATR (the ATR represented as a percentage instead of a raw value), and compares these to one another to get the "Power Rating": a representation of the true strength of a stock over X number of periods. The indicator does two things. First, the raw ROC is divided by the stock's normalized ATR to assess whether the stock is moving outside of its normal range of variation or not. Second, since we are interested in trading only stocks with exceptional RS/RW to the market, I have also applied this same calculation to the S&P500 (SPY) and the various SPDR sector indexes. These comparisons allow for a rapid and accurate assessment of the true strength of a stock at any given time on any given time frame. To cycle back above to our examples, the $100 stock has a Power Rating of only 0.71 (i.e. it is trading less than its current average), while our $20 stock has a Power Rating of 5. If we then compare these to both the market as a whole and the sector that the stock is a part of, we get a much clearer indication of the true buying or selling pressure imposed on the stock at any given time.
Use:
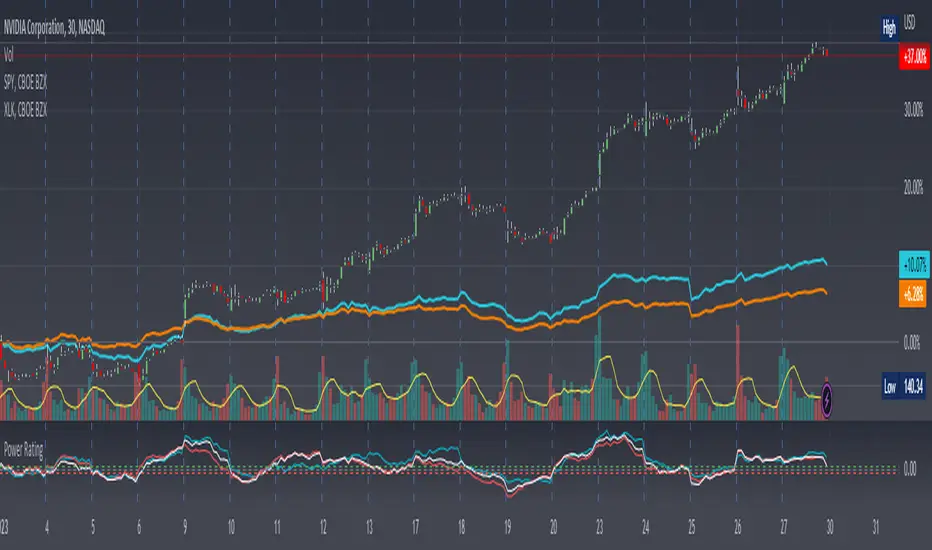
The indicator has 3 lines. The blue line is the security of interest, the red line is the market baseline (i.e. the sector ETFSPY), and the white line is the sector index. I have given an example above on the semiconductor/tech stock NVDA on a 30min timeframe. You can see that since the start of 2023, NVDA has generally been strong to the market and its own sector since the blue line is greater than both the red and white lines over many days. This would have provided some nice day trading opportunities, or even some nice short term swing trades. The values themselves are generally meaningless outside of either the 1 or -1 value lines. All that matters is that the current ticker is surpassing both the market and the sector while being > 1.0 for a long trade or less than -1.0 for a short trade. However, I must stress this indicator gives no trade signals on its own, it is purely a confirmation indicator. An example of a trade would be if you had a trade signal given by either an indicator or by price action suggesting to buy some NVDA for a trade to the upside, the Power Rating indicator would confirm this by showing if NVDA was actually showing true strength by being both greater than 1 (the cutoff for it surpassing its ATR) and being above both the red and white lines. Further, you can see NVDA has been stronger than the market when using the comparison function as well, but the has fluxed in and out of strength intraday when using the actual indicator vs. the static performance ratio chart (plotted as line graphs on the chart).
I have made it possible to change the colour of the plots and the line levels. The adjustment of the line levels gives the trader the flexibility to change their target breakout level (i.e. only trading stocks that have a Power Rating > 2, for example, meaning they are trading at least 2X their normal trading range). The third security comparison is flexible and can be used to compare to the sector ETF (initial intention) or it can be used to compare to other tickers within the same sector, for example. The trader should select the appropriate ETF for the given security of interest to avoid false confirmation if they want to use an ETF as their third input. The proper sector should be readily available on most online websites and accessible in a matter of seconds meaning that the delay is minimal, at worst. If a trader wishes to add additional functionality, such as a crypto trader using BTCUSD as the benchmark instead ofSPY, I encourage them to copy and paste this script and modify as needed since I have made this open source.
This indicator works on all timeframes. The lookback period can be changed, so a day trader who may use a 5min chart (and use a period of 12 to get the hourly Power Rating) will find this equally useful as someone who may be a core trader who wants to look at the performance over the course of years and may use a 60 period on a monthly chart.
Happy trading and I hope this helps!
This idea recently came out of some discussions I stumbled across in a trading group I am a part of regarding Relative Strength and Relative Weakness (shortened to RS and RW from here on out). The whole mechanism behind this trading system is to filter out underperforming securities relative to the current market direction to be in only the strongest or weakest stocks when the market is currently experiencing a bullish or bearish cycle. The idea behind this is there is no point in parking your money into a stock that is treading water or even going down if the market is making strong moves upwards. At that point, you are at worst losing money, and at best trading equal to the index/ETF, in which case the argument is why are you not just trading the index/ETF instead? RS or RW will filter out these sector laggards and allow you to position yourself into strong (or the strongest) stocks at any given time to help improve portfolio performance. Further, not only does it protect your position should the market shift against you briefly, it also often sees exceptional performance in the same cycle. For example, if
RS/RW is based on the idea of performance, that is the raw percent change of a security over a given time period relative to a benchmark. This benchmark is often the S&P500 (ES/SPX/SPY and their derivatives). I have to stress that this is not beta, which measures the volatility of a stock over a given period (i.e. if
Here, I have created an indicator called the Stock Relative Strength Power Index. This takes the stock's rate of change (ROC) (the % move it has made over X number of periods), the stock's normalized ATR (the ATR represented as a percentage instead of a raw value), and compares these to one another to get the "Power Rating": a representation of the true strength of a stock over X number of periods. The indicator does two things. First, the raw ROC is divided by the stock's normalized ATR to assess whether the stock is moving outside of its normal range of variation or not. Second, since we are interested in trading only stocks with exceptional RS/RW to the market, I have also applied this same calculation to the S&P500 (
Use:
The indicator has 3 lines. The blue line is the security of interest, the red line is the market baseline (i.e. the sector ETF
I have made it possible to change the colour of the plots and the line levels. The adjustment of the line levels gives the trader the flexibility to change their target breakout level (i.e. only trading stocks that have a Power Rating > 2, for example, meaning they are trading at least 2X their normal trading range). The third security comparison is flexible and can be used to compare to the sector ETF (initial intention) or it can be used to compare to other tickers within the same sector, for example. The trader should select the appropriate ETF for the given security of interest to avoid false confirmation if they want to use an ETF as their third input. The proper sector should be readily available on most online websites and accessible in a matter of seconds meaning that the delay is minimal, at worst. If a trader wishes to add additional functionality, such as a crypto trader using BTCUSD as the benchmark instead of
This indicator works on all timeframes. The lookback period can be changed, so a day trader who may use a 5min chart (and use a period of 12 to get the hourly Power Rating) will find this equally useful as someone who may be a core trader who wants to look at the performance over the course of years and may use a 60 period on a monthly chart.
Happy trading and I hope this helps!
Mã nguồn mở
Theo đúng tinh thần TradingView, tác giả của tập lệnh này đã công bố nó dưới dạng mã nguồn mở, để các nhà giao dịch có thể xem xét và xác minh chức năng. Chúc mừng tác giả! Mặc dù bạn có thể sử dụng miễn phí, hãy nhớ rằng việc công bố lại mã phải tuân theo Nội quy.
Thông báo miễn trừ trách nhiệm
Thông tin và các ấn phẩm này không nhằm mục đích, và không cấu thành, lời khuyên hoặc khuyến nghị về tài chính, đầu tư, giao dịch hay các loại khác do TradingView cung cấp hoặc xác nhận. Đọc thêm tại Điều khoản Sử dụng.