OPEN-SOURCE SCRIPT
Cập nhật AI Channels (Clustering) [LuxAlgo]
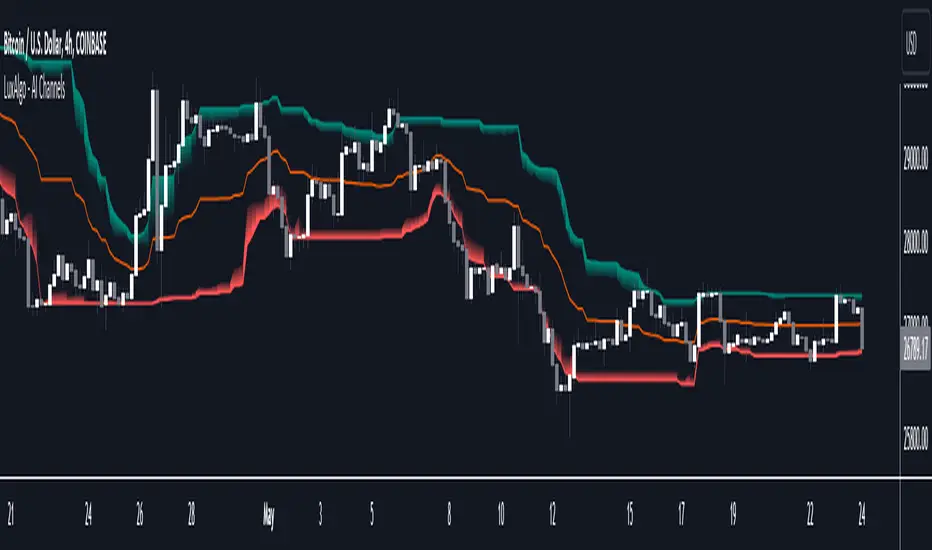
The AI Channels indicator is constructed based on rolling K-means clustering, a common machine learning method used for clustering analysis. These channels allow users to determine the direction of the underlying trends in the price.
We also included an option to display the indicator as a trailing stop from within the settings.
🔶 USAGE

Each channel extremity allows users to determine the current trend direction. Price breaking over the upper extremity suggesting an uptrend, and price breaking below the lower extremity suggesting a downtrend. Using a higher Window Size value will return longer-term indications.

The "Clusters" setting allows users to control how easy it is for the price to break an extremity, with higher values returning extremities further away from the price.
The "Denoise Channels" is enabled by default and allows to see less noisy extremities that are more coherent with the detected trend.

Users who wish to have more focus on a detected trend can display the indicator as a trailing stop.
🔹Centroid Dispersion Areas
Each extremity is made of one area. The width of each area indicates how spread values within a cluster are around their centroids. A wider area would suggest that prices within a cluster are more spread out around their centroid, as such one could say that it is indicative of the volatility of a cluster.
Wider areas around a specific extremity can indicate a larger and more spread-out amount of prices within the associated cluster. In practice price entering an area has a higher chance to break an associated extremity.
🔶 DETAILS

The indicator performs K-means clustering over the most recent Window Size prices, finding a number of user-specified clusters. See here to find more information on cluster detection.
The channel extremities are returned as the centroid of the lowest, average, and highest price clusters.
K-means clustering can be computationally expensive and as such we allow users to determine the maximum number of iterations used to find the centroids as well as the number of most historical bars to perform the indicator calculation. Do note that increasing the calculation window of the indicator as well as the number of clusters will return slower results.
🔶 SETTINGS
We also included an option to display the indicator as a trailing stop from within the settings.
🔶 USAGE
Each channel extremity allows users to determine the current trend direction. Price breaking over the upper extremity suggesting an uptrend, and price breaking below the lower extremity suggesting a downtrend. Using a higher Window Size value will return longer-term indications.
The "Clusters" setting allows users to control how easy it is for the price to break an extremity, with higher values returning extremities further away from the price.
The "Denoise Channels" is enabled by default and allows to see less noisy extremities that are more coherent with the detected trend.
Users who wish to have more focus on a detected trend can display the indicator as a trailing stop.
🔹Centroid Dispersion Areas
Each extremity is made of one area. The width of each area indicates how spread values within a cluster are around their centroids. A wider area would suggest that prices within a cluster are more spread out around their centroid, as such one could say that it is indicative of the volatility of a cluster.
Wider areas around a specific extremity can indicate a larger and more spread-out amount of prices within the associated cluster. In practice price entering an area has a higher chance to break an associated extremity.
🔶 DETAILS
The indicator performs K-means clustering over the most recent Window Size prices, finding a number of user-specified clusters. See here to find more information on cluster detection.
The channel extremities are returned as the centroid of the lowest, average, and highest price clusters.
K-means clustering can be computationally expensive and as such we allow users to determine the maximum number of iterations used to find the centroids as well as the number of most historical bars to perform the indicator calculation. Do note that increasing the calculation window of the indicator as well as the number of clusters will return slower results.
🔶 SETTINGS
- Window Size: Amount of most recent prices to use for the calculation of the indicator.
- Clusters": Amount of clusters detected for the calculation of the indicator.
- Denoise Channels: When enabled, return less noisy channels extremities, disabling this setting will return the exact centroids at each time but will produce less regular extremities.
- As Trailing Stop: Display the indicator as a trailing stop.
🔹 Optimization
This group of settings affects the runtime performance of the script.- Maximum Iteration Steps: Maximum number of iterations allowed for finding centroids. Excessively low values can return a better script load time but poor clustering.
- Historical Bars Calculation: Calculation window of the script (in bars).
- Maximum Iteration Steps: Maximum number of iterations allowed for finding centroids. Excessively low values can return a better script load time but poor clustering.
Phát hành các Ghi chú
Fixed an issue preventing the indicator from appearing on certain tickers/timeframesMã nguồn mở
Theo đúng tinh thần TradingView, tác giả của tập lệnh này đã công bố nó dưới dạng mã nguồn mở, để các nhà giao dịch có thể xem xét và xác minh chức năng. Chúc mừng tác giả! Mặc dù bạn có thể sử dụng miễn phí, hãy nhớ rằng việc công bố lại mã phải tuân theo Nội quy.
Get exclusive indicators & AI trading strategies: luxalgo.com
Free 150k+ community: discord.gg/lux
All content provided by LuxAlgo is for informational & educational purposes only. Past performance does not guarantee future results.
Free 150k+ community: discord.gg/lux
All content provided by LuxAlgo is for informational & educational purposes only. Past performance does not guarantee future results.
Thông báo miễn trừ trách nhiệm
Thông tin và các ấn phẩm này không nhằm mục đích, và không cấu thành, lời khuyên hoặc khuyến nghị về tài chính, đầu tư, giao dịch hay các loại khác do TradingView cung cấp hoặc xác nhận. Đọc thêm tại Điều khoản Sử dụng.
Mã nguồn mở
Theo đúng tinh thần TradingView, tác giả của tập lệnh này đã công bố nó dưới dạng mã nguồn mở, để các nhà giao dịch có thể xem xét và xác minh chức năng. Chúc mừng tác giả! Mặc dù bạn có thể sử dụng miễn phí, hãy nhớ rằng việc công bố lại mã phải tuân theo Nội quy.
Get exclusive indicators & AI trading strategies: luxalgo.com
Free 150k+ community: discord.gg/lux
All content provided by LuxAlgo is for informational & educational purposes only. Past performance does not guarantee future results.
Free 150k+ community: discord.gg/lux
All content provided by LuxAlgo is for informational & educational purposes only. Past performance does not guarantee future results.
Thông báo miễn trừ trách nhiệm
Thông tin và các ấn phẩm này không nhằm mục đích, và không cấu thành, lời khuyên hoặc khuyến nghị về tài chính, đầu tư, giao dịch hay các loại khác do TradingView cung cấp hoặc xác nhận. Đọc thêm tại Điều khoản Sử dụng.