OPEN-SOURCE SCRIPT
US Fed Rate Cut Historical Dates
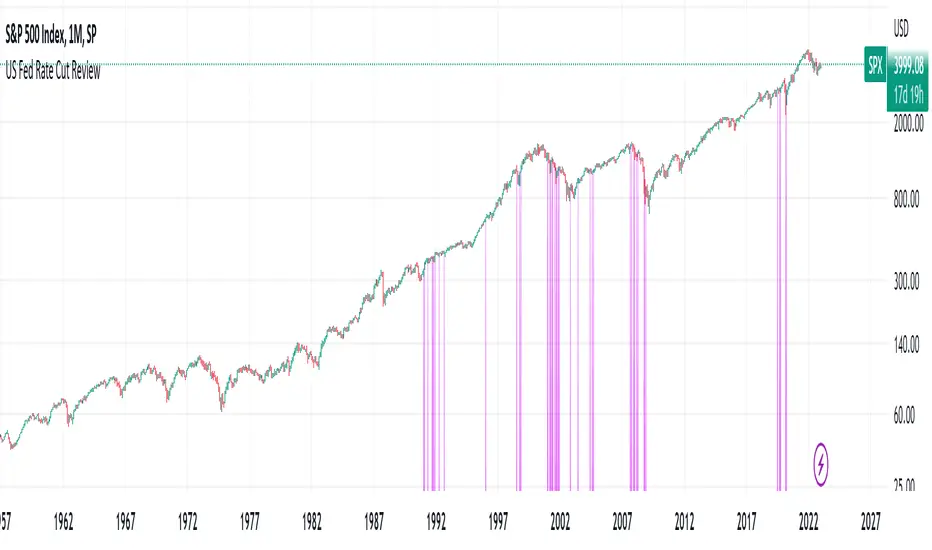
The script applies Purple (color can be changed) highlights to the days that the US Federal Reserve Cut interest rates. Data goes back to the 60's. This can be applied to any chart/timeframe to view how the asset behaved before/during/after Federal Rate cuts.
****This was updated as of Dec 2022... Any decisions after Dec 2022 will not show up in this indicator.
Versions may be updated periodically to include new data.
Hope this helps. Happy Trades
-SnarkyPuppy
****This was updated as of Dec 2022... Any decisions after Dec 2022 will not show up in this indicator.
Versions may be updated periodically to include new data.
Hope this helps. Happy Trades
-SnarkyPuppy
Mã nguồn mở
Theo đúng tinh thần TradingView, tác giả của tập lệnh này đã công bố nó dưới dạng mã nguồn mở, để các nhà giao dịch có thể xem xét và xác minh chức năng. Chúc mừng tác giả! Mặc dù bạn có thể sử dụng miễn phí, hãy nhớ rằng việc công bố lại mã phải tuân theo Nội quy.
Thông báo miễn trừ trách nhiệm
Thông tin và các ấn phẩm này không nhằm mục đích, và không cấu thành, lời khuyên hoặc khuyến nghị về tài chính, đầu tư, giao dịch hay các loại khác do TradingView cung cấp hoặc xác nhận. Đọc thêm tại Điều khoản Sử dụng.