OPEN-SOURCE SCRIPT
Cập nhật Price Data Label
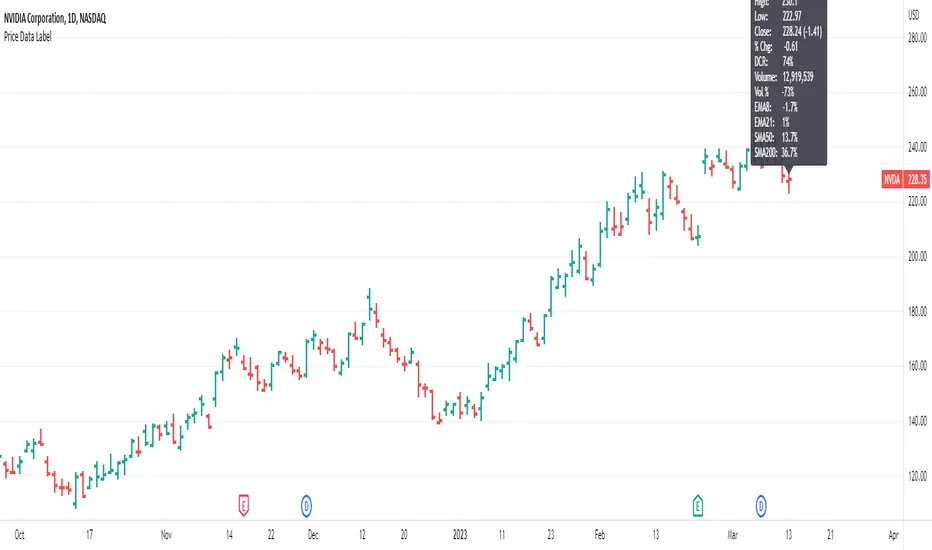
This indicator gives you the ability to see historical data for each bar on the chart by simply hovering over the high of the bar, similar to the functionality of MarketSmith.
Data for each bar includes:
Example of stats on a historical bar:

* Note this only works on the last 500 historical bars. If you use bar replay it will work with 500 historical bars from the last bar.
* If you have multiple indicators on your chart, in order to see the data you will need to use visual order to bring to front. This can be done by clicking the three dots next to the indicator name and selecting visual order.

Data for each bar includes:
- Open
- High
- Low
- Close + Change
- Percentage Change
- Closing Range
- Volume
- Volume Percent based on 50 day average
- Distance to 4 selectable moving averages
Example of stats on a historical bar:
* Note this only works on the last 500 historical bars. If you use bar replay it will work with 500 historical bars from the last bar.
* If you have multiple indicators on your chart, in order to see the data you will need to use visual order to bring to front. This can be done by clicking the three dots next to the indicator name and selecting visual order.
Phát hành các Ghi chú
Turned off the label always showing that was needed for picture. Phát hành các Ghi chú
Added moving average values to the labelPhát hành các Ghi chú
Update to show index volume for the Nasdaq and SPX as well as calculate the index volume percent change vs 50 day average volume. Phát hành các Ghi chú
Update now allows for selectable weekly moving averages. The label will automatically adjust to the user selected weekly moving averages when looking at a weekly chart. Phát hành các Ghi chú
Volume % calculation is now based on the run rate to show the projected volume finish compared to the average volume. Phát hành các Ghi chú
Added a new required parameter to the time format function in the code.Phát hành các Ghi chú
option to view % as ATRMã nguồn mở
Theo đúng tinh thần TradingView, tác giả của tập lệnh này đã công bố nó dưới dạng mã nguồn mở, để các nhà giao dịch có thể xem xét và xác minh chức năng. Chúc mừng tác giả! Mặc dù bạn có thể sử dụng miễn phí, hãy nhớ rằng việc công bố lại mã phải tuân theo Nội quy.
Trusted Pine programmer. Send me a message for script development.
Thông báo miễn trừ trách nhiệm
Thông tin và các ấn phẩm này không nhằm mục đích, và không cấu thành, lời khuyên hoặc khuyến nghị về tài chính, đầu tư, giao dịch hay các loại khác do TradingView cung cấp hoặc xác nhận. Đọc thêm tại Điều khoản Sử dụng.
Mã nguồn mở
Theo đúng tinh thần TradingView, tác giả của tập lệnh này đã công bố nó dưới dạng mã nguồn mở, để các nhà giao dịch có thể xem xét và xác minh chức năng. Chúc mừng tác giả! Mặc dù bạn có thể sử dụng miễn phí, hãy nhớ rằng việc công bố lại mã phải tuân theo Nội quy.
Trusted Pine programmer. Send me a message for script development.
Thông báo miễn trừ trách nhiệm
Thông tin và các ấn phẩm này không nhằm mục đích, và không cấu thành, lời khuyên hoặc khuyến nghị về tài chính, đầu tư, giao dịch hay các loại khác do TradingView cung cấp hoặc xác nhận. Đọc thêm tại Điều khoản Sử dụng.