OPEN-SOURCE SCRIPT
Multi Asset + Correlation Overlay
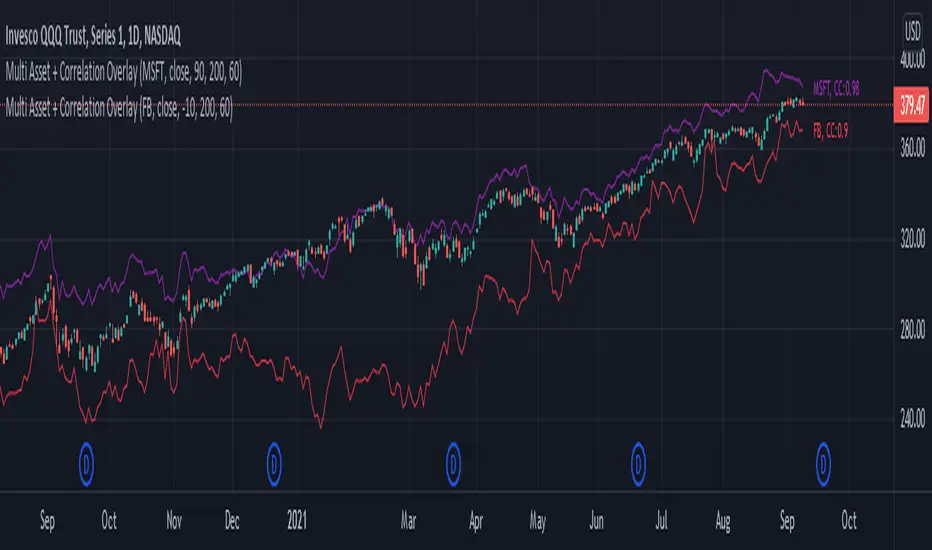
From time to time, you may want to overlay multiple assets on the same chart instead of using multi-chart views. This can be a much cleaner way of viewing and comparing multiple assets. There is some functionality built into TradingView that lets you do this to a certain extent, but I wanted additional options, correlation labeling and ways to adjust the overlay location. So, today I am releasing to the community my Multi-Asset + Correlation Overlay script / indicator.
What is does: This script allows you to overlay the price of any ticker onto your chart. It also labels the line with the ticker name, and calculates / labels the correlation coefficient of your newly overlayed asset.
How to use it: Add the indicator to your chart. Then, go into the indicator settings to set the ticker of the asset you want to pull in along with how you want to "offset" it. Your 2 tickers may not be priced near each-other, so the offset setting allows you to pull the ticker you added up/down to better visually align with your chart's price range/layout. For instance, if the asset you added is priced $400 higher than the underlying chart price, you may want to set the offset to -400.
If you would like to add multiple tickers and multiple overlays, you can do that by just adding the indicator to your chart more than once. The color is adjustable, and the ticker of the asset will print to the right of the line representing the asset price. The script also calculates the correlation coefficient between the ticker overlay and the underlying chart asset. The correlation coefficient prints to the right of the ticker.
Mã nguồn mở
Theo đúng tinh thần TradingView, tác giả của tập lệnh này đã công bố nó dưới dạng mã nguồn mở, để các nhà giao dịch có thể xem xét và xác minh chức năng. Chúc mừng tác giả! Mặc dù bạn có thể sử dụng miễn phí, hãy nhớ rằng việc công bố lại mã phải tuân theo Nội quy.
Want to build custom alerts and custom strategies? Interested in automated trading?
Hire me to code or automate your trading strategy, or schedule a free consultation at:
TradeAutomation.net
Hire me to code or automate your trading strategy, or schedule a free consultation at:
TradeAutomation.net
Thông báo miễn trừ trách nhiệm
Thông tin và các ấn phẩm này không nhằm mục đích, và không cấu thành, lời khuyên hoặc khuyến nghị về tài chính, đầu tư, giao dịch hay các loại khác do TradingView cung cấp hoặc xác nhận. Đọc thêm tại Điều khoản Sử dụng.