OPEN-SOURCE SCRIPT
RSI - ARIEIV
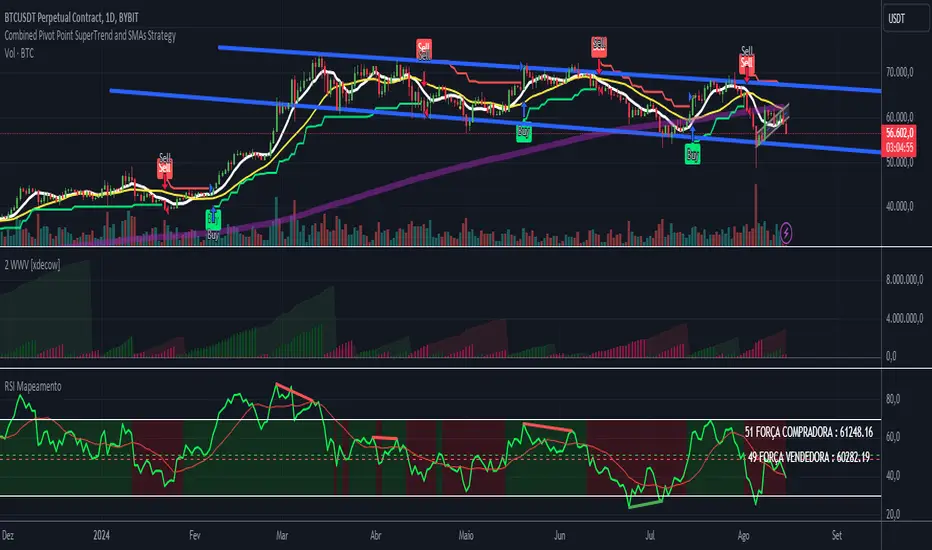
he RSI MAPPING - ARIEIV is a powerful technical indicator based on the Relative Strength Index (RSI) combined with moving averages and divergence detection. This indicator is designed to provide a clear view of overbought and oversold conditions, as well as identifying potential reversals and signals for market entries and exits.
Key Features:
Customizable RSI:
The indicator offers flexibility in adjusting the RSI length and data source (closing price, open price, etc.).
The overbought and oversold lines can be customized, allowing the RSI to signal critical market zones according to the trader’s strategy.
RSI-Based Moving Averages (MA):
Users can enable a moving average based on the RSI with support for multiple types such as SMA, EMA, WMA, VWMA, and SMMA (RMA).
For those who prefer Bollinger Bands, there’s an option to use the moving average with standard deviation to detect market volatility.
Divergence Detection:
Detects both regular and hidden divergences (bullish and bearish) between price and RSI, which can indicate potential market reversals.
These divergences can be customized with specific colors for easy identification on the chart, allowing traders to quickly spot significant market shifts.
Zone Mapping:
The script maps zones of buying and selling strength, filling the areas between the overbought and oversold levels with specific colors, highlighting when the market is in extreme conditions.
Strength Tables:
At the end of each session, a table appears on the right side of the chart, displaying the "Buying Strength" and "Selling Strength" based on calculated RSI levels. This allows for quick analysis of the dominant pressure in the market.
Flexible Settings:
Many customization options are available, from adjusting the number of decimal places to the choice of colors and the ability to toggle elements on or off within the chart.
Mã nguồn mở
Theo đúng tinh thần TradingView, tác giả của tập lệnh này đã công bố nó dưới dạng mã nguồn mở, để các nhà giao dịch có thể xem xét và xác minh chức năng. Chúc mừng tác giả! Mặc dù bạn có thể sử dụng miễn phí, hãy nhớ rằng việc công bố lại mã phải tuân theo Nội quy.
Thông báo miễn trừ trách nhiệm
Thông tin và các ấn phẩm này không nhằm mục đích, và không cấu thành, lời khuyên hoặc khuyến nghị về tài chính, đầu tư, giao dịch hay các loại khác do TradingView cung cấp hoặc xác nhận. Đọc thêm tại Điều khoản Sử dụng.