OPEN-SOURCE SCRIPT
ABC Pattern
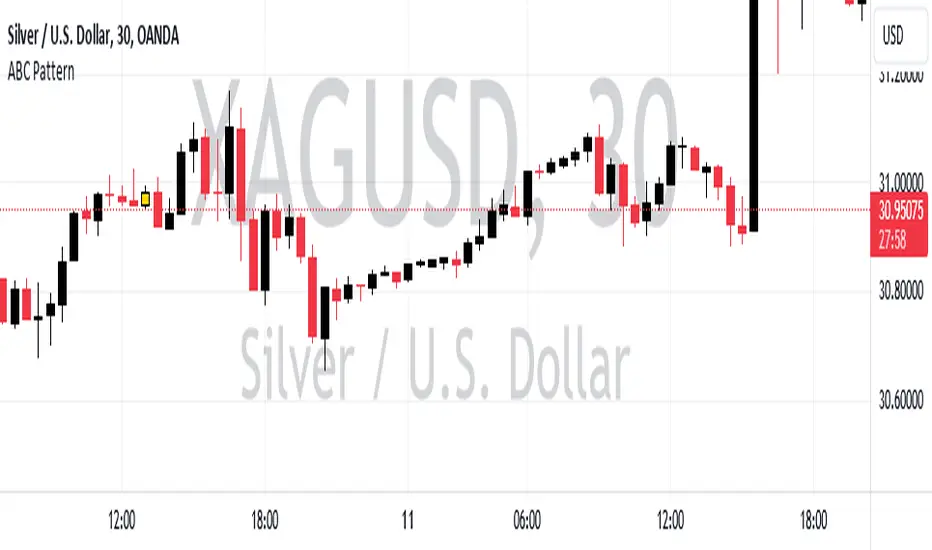
The indicator, named "ABC Pattern," is designed to identify specific bullish and bearish patterns on a price chart. Here's a simple explanation of what it does:
What the Indicator Does:
1. Identifies Bullish Patterns:
- The indicator looks for a sequence of candles where certain conditions are met to form a bullish pattern.
- When it detects a bullish pattern, it colors the candle that occurred three periods ago in gold.
2. Identifies Bearish Patterns:
- Similarly, it looks for a sequence of candles where certain conditions are met to form a bearish pattern.
- When it detects a bearish pattern, it colors the candle that occurred three periods ago in pinkish.
3. Creates Alerts:
- Whenever a bullish or bearish pattern is identified, the indicator generates an alert.
- The alert message includes the type of pattern (bullish or bearish), the price level at the time of detection, and the date and time of the pattern formation.
Detailed Conditions:
- Bullish Pattern:
- The current candle closes higher than it opened.
- The previous candle also closes higher than it opened.
- Two candles ago, the candle closed lower than it opened.
- Three candles ago, the candle closed higher than it opened.
- The highest price of two candles ago is below the current close.
- The lowest price of three candles ago is above the close of two candles ago.
- The highest price of three candles ago is below the current close.
- Bearish Pattern:
- The current candle closes lower than it opened.
- The previous candle also closes lower than it opened.
- Two candles ago, the candle closed higher than it opened.
- Three candles ago, the candle closed lower than it opened.
- The lowest price of two candles ago is above the current close.
- The highest price of three candles ago is below the close of two candles ago.
- The lowest price of three candles ago is above the current close.
Visual Representation:
- Gold Color: Indicates a detected bullish pattern.
- Pinkish Color: Indicates a detected bearish pattern.
Alerts:
- Alert Message: "ABC Pattern has appeared!"
- Detailed Alerts: Include the type of pattern, price level, and timestamp for better analysis and decision-making.
This indicator helps traders visually and audibly detect potential bullish and bearish patterns on their charts, aiding in making more informed trading decisions.
Mã nguồn mở
Theo đúng tinh thần TradingView, tác giả của tập lệnh này đã công bố nó dưới dạng mã nguồn mở, để các nhà giao dịch có thể xem xét và xác minh chức năng. Chúc mừng tác giả! Mặc dù bạn có thể sử dụng miễn phí, hãy nhớ rằng việc công bố lại mã phải tuân theo Nội quy.
Thông báo miễn trừ trách nhiệm
Thông tin và các ấn phẩm này không nhằm mục đích, và không cấu thành, lời khuyên hoặc khuyến nghị về tài chính, đầu tư, giao dịch hay các loại khác do TradingView cung cấp hoặc xác nhận. Đọc thêm tại Điều khoản Sử dụng.