OPEN-SOURCE SCRIPT
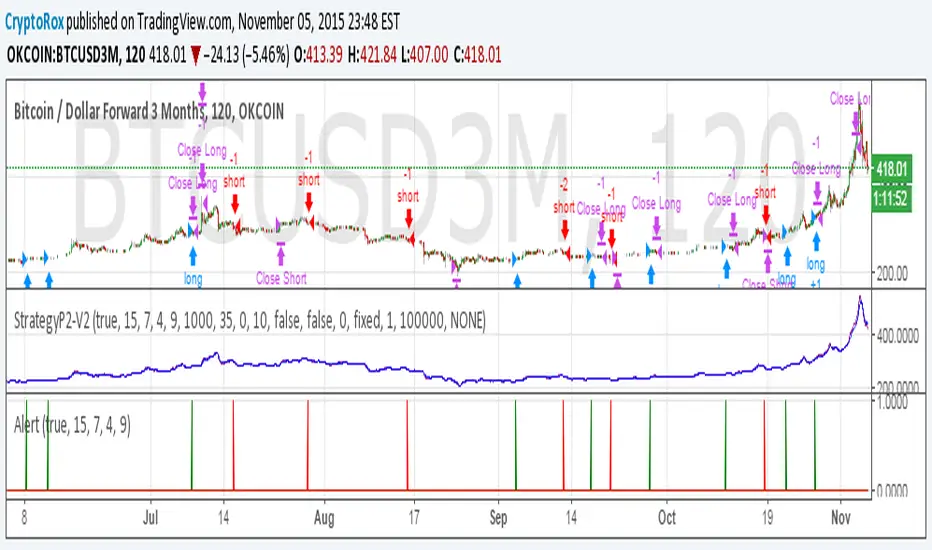
Cập nhật P2-V2 - BTC Strategy

P2-V2 also known as Penner2.0 began with a TEMA and MA cross on Heiken Ashi, a strategy brought to us by a group of crypto traders. Since then we've added a few more indicators and played around with the rules.
This is an early release as I have yet to go through the full automation aspect, however, I know some of you would like to see where it's at.
If you'd like to learn how to automate a full strategy using the Chrome Extension, go to the linked idea for a eurusd setup.
This is an early release as I have yet to go through the full automation aspect, however, I know some of you would like to see where it's at.
If you'd like to learn how to automate a full strategy using the Chrome Extension, go to the linked idea for a eurusd setup.
Ghi chú
Alert Script://version=2
study("P2-V2", shorttitle="Alerts", overlay=false)
//Heiken Ashi Candles
Factor = 3
Pd = 7
isHA = input(true, "HA Candles", bool)
data = isHA ? heikenashi(tickerid) : tickerid
o = security(data, period, open)
h = security(data, period, high)
l = security(data, period, low)
c = security(data, period, close)
//Triple EMA
temaLength = input(15, minval=1)
ema1 = ema(c, temaLength)
ema2 = ema(ema1, temaLength)
ema3 = ema(ema2, temaLength)
tema = 3 * (ema1 - ema2) + ema3
//Moving Average
smaLength = input(7, minval=1)
sma = sma(c, smaLength)
//RSI
src = c
rsiLength = input(4, minval=1, title="Length")
up = rma(max(change(src), 0), rsiLength)
down = rma(-min(change(src), 0), rsiLength)
rsi = down == 0 ? 100 : up == 0 ? 0 : 100 - (100 / (1 + up / down))
rsin= input(9)
sn = 100 - rsin
ln = 0 + rsin
//Strategy
gc = c > o ? 1 : 0
rc = c < o ? 1 : 0
long = crossover(tema[2], sma[2]) and gc[1] == 1 and gc == 1 and rsi > sn
short = crossunder(tema[2], sma[2]) and rc[1] == 1 and rc == 1 and rsi < ln
plot(long, "long", color=green)
plot(short, "short", color=red)
Ghi chú
The above alert script did not copy/paste properly and is getting an error, to avoid clutter, just replace the bottom section @ //Strategy//Strategy
gc = c > o ? 1 : 0
rc = c < o ? 1 : 0
long = crossover(tema[2], sma[2]) and gc[1] == 1 and gc == 1 and rsi > sn
short = crossunder(tema[2], sma[2]) and rc[1] == 1 and rc == 1 and rsi < ln
plot(long, "long", color=green)
plot(short, "short", color=red)
Ghi chú
Let's try this again...//Strategy
gc = c > o ? 1 : 0
rc = c < o ? 1 : 0
long = crossover(tema[2], sma[2]) and gc[1] == 1 and gc == 1 and rsi > sn
short = crossunder(tema[2], sma[2]) and rc[1] == 1 and rc == 1 and rsi < ln
plot(long, "long", color=green)
plot(short, "short", color=red)
Ghi chú
All orders are now being tracked in a Google Sheet for public viewing. Since: 08/12/2014 07:00:00
Net Profit = $644.58 in BTC value
Link for tracked statistics here:
bit.ly/1SMvGVu
Ghi chú
To avoid repainting, this code needs to be adjusted. Results actually improve once the issue is corrected.On line 11 - 14 you'll see this...
o = security(data, period, open)
h = security(data, period, high)
l = security(data, period, low)
c = security(data, period, close)
we need to actually use the previous candle to avoid repainting, so just add a 1 candle look back.
square brackets 1 after the words "open, high, low, close"
TV does not let me paste the brackets, but you can see on line 12-16 of this strategy here what is needed.
![[AutoView] Automate it -Heiken Ashi, No pyramiding or repainting](https://s3.tradingview.com/w/wEZWjpGY_mid.png)
Hope this makes sense. Good luck.
Phát hành các Ghi chú
Updated to Pinescript version 3 and added the new standard components.Mã nguồn mở
Theo đúng tinh thần TradingView, tác giả của tập lệnh này đã công bố nó dưới dạng mã nguồn mở, để các nhà giao dịch có thể xem xét và xác minh chức năng. Chúc mừng tác giả! Mặc dù bạn có thể sử dụng miễn phí, hãy nhớ rằng việc công bố lại mã phải tuân theo Nội quy.
Thông báo miễn trừ trách nhiệm
Thông tin và các ấn phẩm này không nhằm mục đích, và không cấu thành, lời khuyên hoặc khuyến nghị về tài chính, đầu tư, giao dịch hay các loại khác do TradingView cung cấp hoặc xác nhận. Đọc thêm tại Điều khoản Sử dụng.
Mã nguồn mở
Theo đúng tinh thần TradingView, tác giả của tập lệnh này đã công bố nó dưới dạng mã nguồn mở, để các nhà giao dịch có thể xem xét và xác minh chức năng. Chúc mừng tác giả! Mặc dù bạn có thể sử dụng miễn phí, hãy nhớ rằng việc công bố lại mã phải tuân theo Nội quy.
Thông báo miễn trừ trách nhiệm
Thông tin và các ấn phẩm này không nhằm mục đích, và không cấu thành, lời khuyên hoặc khuyến nghị về tài chính, đầu tư, giao dịch hay các loại khác do TradingView cung cấp hoặc xác nhận. Đọc thêm tại Điều khoản Sử dụng.
