OPEN-SOURCE SCRIPT
Cập nhật Blood Moons
Blood Moon Dates
Description:
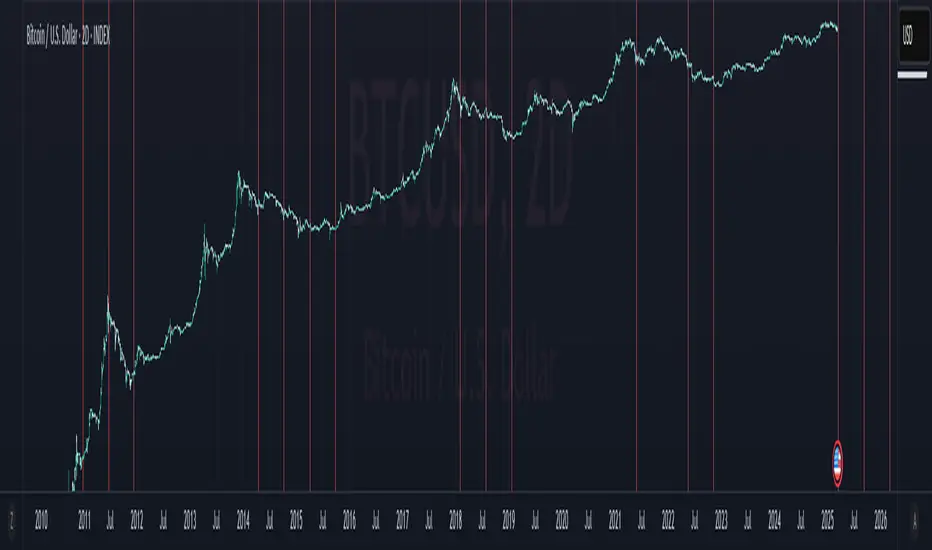
This indicator overlays vertical lines on your chart to mark the dates of total lunar eclipses (commonly known as "Blood Moons") from December 2010 to May 2040. Designed with cryptocurrency traders in mind, it’s perfect for analyzing potential correlations between these celestial events and price movements. The lines are drawn on the first bar and extend across the chart, making it easy to spot these dates on any timeframe.
Features:
Plots vertical lines for 19 Blood Moon events (2010–2040).
Customizable line color, style (solid, dotted, dashed), and width.
Option to toggle lines on/off for a cleaner chart.
Lines extend both ways for maximum visibility across your chart.
Settings:
Show Lines: Enable or disable the lines (default: enabled).
Line Color: Choose your preferred color (default: red).
Line Style: Select solid, dotted, or dashed (default: dotted).
Line Width: Adjust thickness from 1 to 5 (default: 2).
Usage:
Add this indicator to your chart to visualize Blood Moon dates alongside price action. Customize the appearance to suit your analysis style. Note: Lines are plotted based on timestamps and extend across the chart, so they’re best viewed on daily or higher timeframes for clarity.
Disclaimer:
This is an educational tool and not financial advice. Past performance does not guarantee future results. Use at your own risk.
Description:
This indicator overlays vertical lines on your chart to mark the dates of total lunar eclipses (commonly known as "Blood Moons") from December 2010 to May 2040. Designed with cryptocurrency traders in mind, it’s perfect for analyzing potential correlations between these celestial events and price movements. The lines are drawn on the first bar and extend across the chart, making it easy to spot these dates on any timeframe.
Features:
Plots vertical lines for 19 Blood Moon events (2010–2040).
Customizable line color, style (solid, dotted, dashed), and width.
Option to toggle lines on/off for a cleaner chart.
Lines extend both ways for maximum visibility across your chart.
Settings:
Show Lines: Enable or disable the lines (default: enabled).
Line Color: Choose your preferred color (default: red).
Line Style: Select solid, dotted, or dashed (default: dotted).
Line Width: Adjust thickness from 1 to 5 (default: 2).
Usage:
Add this indicator to your chart to visualize Blood Moon dates alongside price action. Customize the appearance to suit your analysis style. Note: Lines are plotted based on timestamps and extend across the chart, so they’re best viewed on daily or higher timeframes for clarity.
Disclaimer:
This is an educational tool and not financial advice. Past performance does not guarantee future results. Use at your own risk.
Phát hành các Ghi chú
quality of life with auto scaling issueswould prefer vertical lines but pinescript is too picky with those
opting for shapes instead
Phát hành các Ghi chú
script name fix from BM Balls to Blood MoonsPhát hành các Ghi chú
fixed bugwill have to check in a couple days whether that blood moon date prints a shape
Phát hành các Ghi chú
updating default color/transpPhát hành các Ghi chú
reverting to near original, pinescript sucks btwPhát hành các Ghi chú
updated future datesMã nguồn mở
Theo đúng tinh thần TradingView, tác giả của tập lệnh này đã công bố nó dưới dạng mã nguồn mở, để các nhà giao dịch có thể xem xét và xác minh chức năng. Chúc mừng tác giả! Mặc dù bạn có thể sử dụng miễn phí, hãy nhớ rằng việc công bố lại mã phải tuân theo Nội quy.
Thông báo miễn trừ trách nhiệm
Thông tin và các ấn phẩm này không nhằm mục đích, và không cấu thành, lời khuyên hoặc khuyến nghị về tài chính, đầu tư, giao dịch hay các loại khác do TradingView cung cấp hoặc xác nhận. Đọc thêm tại Điều khoản Sử dụng.
Mã nguồn mở
Theo đúng tinh thần TradingView, tác giả của tập lệnh này đã công bố nó dưới dạng mã nguồn mở, để các nhà giao dịch có thể xem xét và xác minh chức năng. Chúc mừng tác giả! Mặc dù bạn có thể sử dụng miễn phí, hãy nhớ rằng việc công bố lại mã phải tuân theo Nội quy.
Thông báo miễn trừ trách nhiệm
Thông tin và các ấn phẩm này không nhằm mục đích, và không cấu thành, lời khuyên hoặc khuyến nghị về tài chính, đầu tư, giao dịch hay các loại khác do TradingView cung cấp hoặc xác nhận. Đọc thêm tại Điều khoản Sử dụng.