OPEN-SOURCE SCRIPT
Cập nhật RSI Candle 12-Band Spectrum
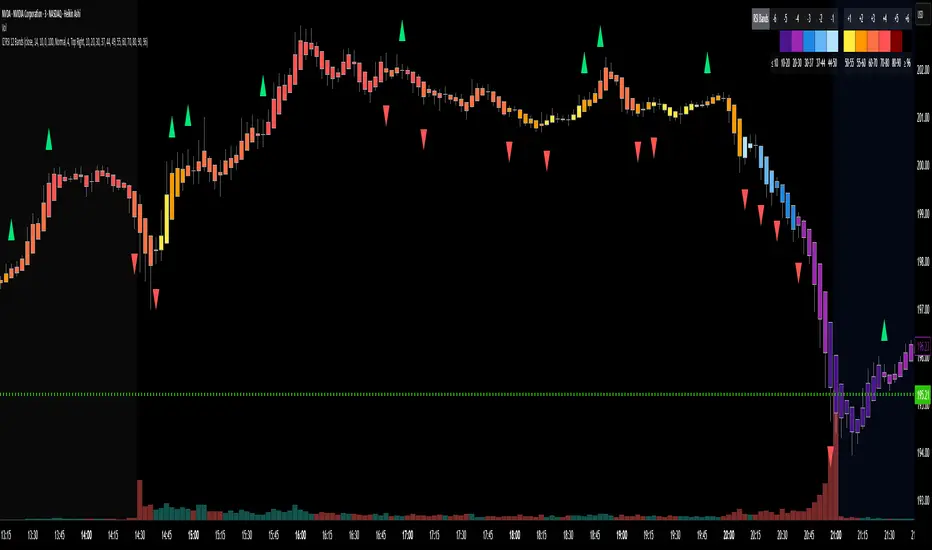
Experience RSI like never before. This multi-band visualizer transforms relative strength into a living color map — directly over price action — revealing momentum shifts long before traditional RSI signals.
🔹 12 Dynamic RSI Bands – A full emotional spectrum from oversold to overbought, colored from deep blue to burning red.
🔹 Adaptive Pulse System – Highlights every shift in RSI state with an intelligent fade-out pulse that measures the strength of each rotation.
🔹 Precision Legend Display – Clear RSI cutoff zones with user-defined thresholds and color ranges.
🔹 Multi-Timeframe Engine – Optionally view higher-timeframe RSI context while scalping lower frames.
🔹 Stealth Mode – Borders-only visualization for minimal chart impact on dark themes.
🔹 Complete Customization – Adjustable band levels, color palettes, and fade behavior.
🧠 Designed for professional traders who move with rhythm, not randomness.
Phát hành các Ghi chú
🆕 Update v2.0 — “No More Floating Arrows” ✅Complete overhaul of the RSI band-change arrow system for perfect precision.
Arrows are now candle-anchored (abovebar / belowbar) and share the main price scale — no more floating mid-screen.
Cleaner visuals, lighter performance, and 100% accurate alignment across all chart types and timeframes.
Mã nguồn mở
Theo đúng tinh thần TradingView, tác giả của tập lệnh này đã công bố nó dưới dạng mã nguồn mở, để các nhà giao dịch có thể xem xét và xác minh chức năng. Chúc mừng tác giả! Mặc dù bạn có thể sử dụng miễn phí, hãy nhớ rằng việc công bố lại mã phải tuân theo Nội quy.
Thông báo miễn trừ trách nhiệm
Thông tin và các ấn phẩm này không nhằm mục đích, và không cấu thành, lời khuyên hoặc khuyến nghị về tài chính, đầu tư, giao dịch hay các loại khác do TradingView cung cấp hoặc xác nhận. Đọc thêm tại Điều khoản Sử dụng.