OPEN-SOURCE SCRIPT
Cập nhật Sadosi Gap Selecter
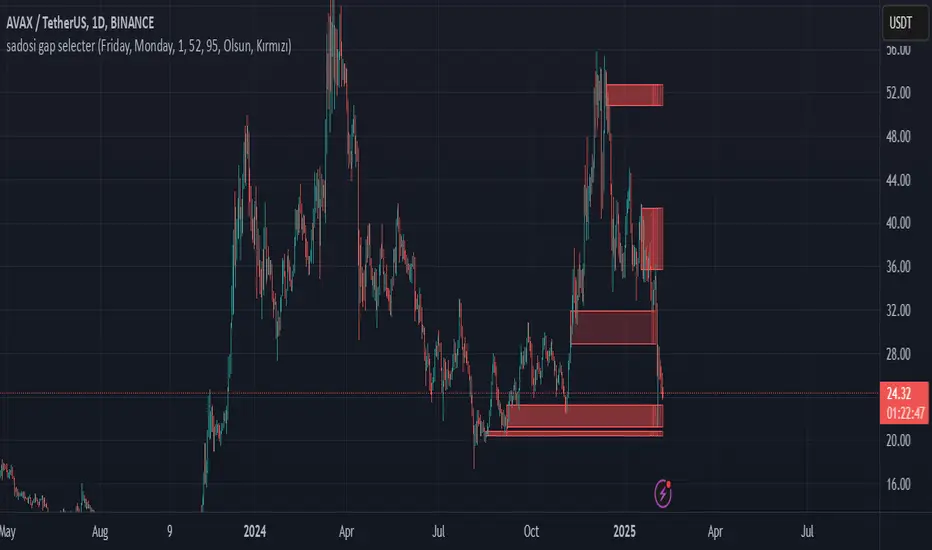
This indicator is designed to be used on daily charts. Please note that it will not work with weekly or hourly data.
The Sadosi Gap Selecter is a powerful indicator designed to identify price gaps that occur between specific dates on the chart. It allows users to easily analyze price movements between selected weeks and days, highlighting these periods with visual boxes. This helps traders spot potential trend reversals and key price levels more effectively. It’s particularly valuable for those utilizing gap trading strategies to identify market inefficiencies.
The core functionality of this indicator is based on detecting price differences between two selected days within a defined date range. With the Start Day (day1) and End Day (day2) options, you can choose the exact days of the week you’d like to analyze. For instance, if you want to focus on price movements from Friday to Monday, simply select those days. Additionally, the Start Week (week1) and End Week (week2) settings allow you to narrow down the time frame on a weekly basis, making it easy to analyze price behavior during specific periods of the year.
For visual customization, several options are available. The Color (renk) setting lets you choose between red and yellow for the highlighted boxes. The Transparency (op) control adjusts the background opacity from 0% (fully opaque) to 100% (completely transparent), allowing you to manage how prominently the boxes appear on your chart. Furthermore, the Border (hat) option enables you to add or remove borders around the boxes, helping reduce visual clutter or emphasize certain areas depending on your preference.
Once applied to the chart, the indicator automatically generates boxes for the specified date ranges. The upper and lower bounds of each box are determined based on the price movement within that period, providing insights into the direction and strength of the trend. However, this tool does not generate definitive buy or sell signals on its own. It is recommended to use it alongside other technical analysis tools to make more informed trading decisions.
With the Sadosi Gap Selecter, you can gain clearer insights into price behavior, strengthen your trend analyses using historical data, and fully customize the settings to match your trading style for more effective results.
This indicator is designed to be used on daily charts. Please note that it will not work with weekly or hourly data
Phát hành các Ghi chú
The Sadosi Gap Selecter is a powerful indicator designed to identify price gaps that occur between specific dates on the chart. It allows users to easily analyze price movements between selected weeks and days, highlighting these periods with visual boxes. This helps traders spot potential trend reversals and key price levels more effectively. It’s particularly valuable for those utilizing gap trading strategies to identify market inefficiencies.The core functionality of this indicator is based on detecting price differences between two selected days within a defined date range. With the Start Day (day1) and End Day (day2) options, you can choose the exact days of the week you’d like to analyze. For instance, if you want to focus on price movements from Friday to Monday, simply select those days. Additionally, the Start Week (week1) and End Week (week2) settings allow you to narrow down the time frame on a weekly basis, making it easy to analyze price behavior during specific periods of the year.
For visual customization, several options are available. The Color (renk) setting lets you choose between red and yellow for the highlighted boxes. The Transparency (op) control adjusts the background opacity from 0% (fully opaque) to 100% (completely transparent), allowing you to manage how prominently the boxes appear on your chart. Furthermore, the Border (hat) option enables you to add or remove borders around the boxes, helping reduce visual clutter or emphasize certain areas depending on your preference.
Once applied to the chart, the indicator automatically generates boxes for the specified date ranges. The upper and lower bounds of each box are determined based on the price movement within that period, providing insights into the direction and strength of the trend. However, this tool does not generate definitive buy or sell signals on its own. It is recommended to use it alongside other technical analysis tools to make more informed trading decisions.
With the Sadosi Gap Selecter, you can gain clearer insights into price behavior, strengthen your trend analyses using historical data, and fully customize the settings to match your trading style for more effective results.
Note: This indicator is designed to be used on daily charts. Please note that it will not work with weekly or hourly data.
Mã nguồn mở
Theo đúng tinh thần TradingView, tác giả của tập lệnh này đã công bố nó dưới dạng mã nguồn mở, để các nhà giao dịch có thể xem xét và xác minh chức năng. Chúc mừng tác giả! Mặc dù bạn có thể sử dụng miễn phí, hãy nhớ rằng việc công bố lại mã phải tuân theo Nội Quy.
Thông báo miễn trừ trách nhiệm
Thông tin và các ấn phẩm này không nhằm mục đích, và không cấu thành, lời khuyên hoặc khuyến nghị về tài chính, đầu tư, giao dịch hay các loại khác do TradingView cung cấp hoặc xác nhận. Đọc thêm tại Điều khoản Sử dụng.