OPEN-SOURCE SCRIPT
Pappabborgia Nasdaq RSI
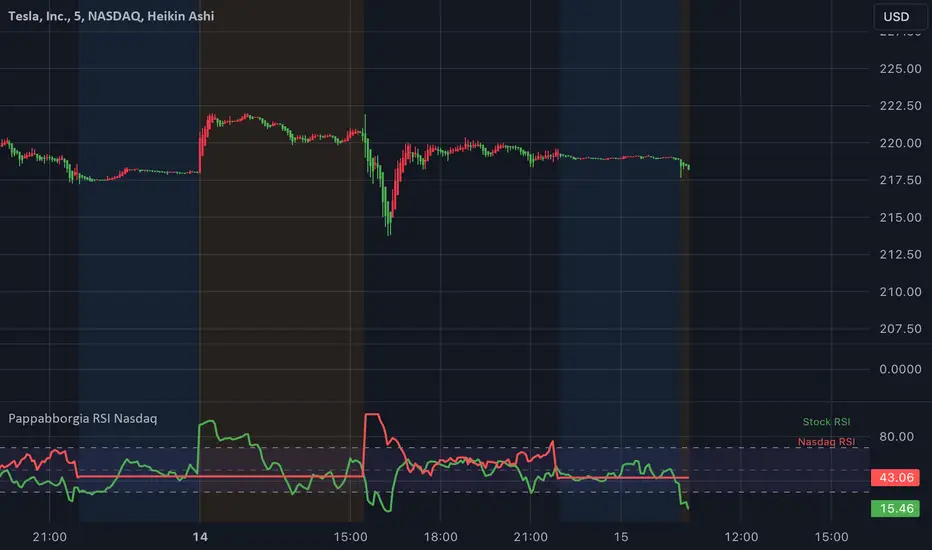
This script provides a custom Relative Strength Index (RSI) indicator that plots both the RSI of the selected stock and the Nasdaq (IXIC) on the same chart.
It offers a clear, side-by-side view to help traders better understand the stock's momentum relative to the overall market.
Key Features:
RSI Calculation for the Stock:
The script calculates the RSI for the chosen stock, with a default period of 14, adjustable to fit different timeframes.
The stock’s RSI is displayed in green 🟢, providing a direct view of its strength and momentum 📈.
RSI of the Nasdaq:
The script fetches the Nasdaq’s closing prices and calculates its RSI, which is shown in red for clear comparison 🔴.
Legend for Clarity:
A simple legend in the top-right corner identifies the green line as the stock’s RSI and the red line as the Nasdaq’s RSI, making it easy to interpret 📊.
Why Comparing the Stock's RSI to the Nasdaq Matters:
Broader Market Context:
Viewing both RSIs on the same chart helps you see whether the stock is moving in sync with the broader market or behaving independently. This provides valuable context for decision-making 📉.
Relative Strength Insights:
Comparing the stock’s RSI to the Nasdaq’s RSI highlights whether the stock is outperforming or underperforming the overall market, helping identify potential opportunities or risks 🟢🔴.
Improved Risk Management:
Monitoring overbought or oversold conditions in both the stock and Nasdaq RSIs can signal broader market trends and help avoid risky trades ⚠️.
Overall Benefit:
By tracking the RSI of both the stock and the Nasdaq, this script offers a powerful tool for understanding a stock's relative strength, providing essential context for smarter trading decisions 🎯.
Mã nguồn mở
Theo đúng tinh thần TradingView, tác giả của tập lệnh này đã công bố nó dưới dạng mã nguồn mở, để các nhà giao dịch có thể xem xét và xác minh chức năng. Chúc mừng tác giả! Mặc dù bạn có thể sử dụng miễn phí, hãy nhớ rằng việc công bố lại mã phải tuân theo Nội Quy.
Thông báo miễn trừ trách nhiệm
Thông tin và các ấn phẩm này không nhằm mục đích, và không cấu thành, lời khuyên hoặc khuyến nghị về tài chính, đầu tư, giao dịch hay các loại khác do TradingView cung cấp hoặc xác nhận. Đọc thêm tại Điều khoản Sử dụng.