OPEN-SOURCE SCRIPT
Cập nhật Seri Indicator 0.1
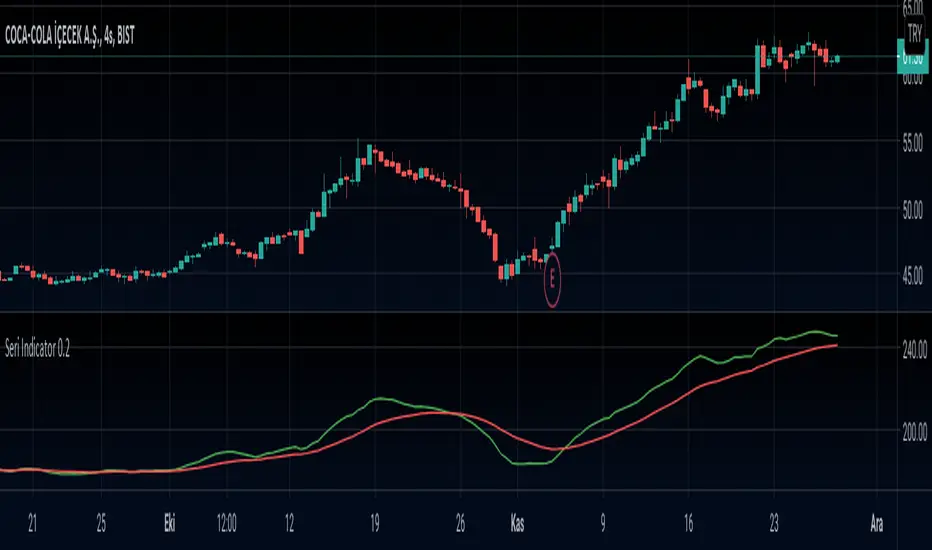
This is a Moving Average based indicator that is inspired by the MACD indicator. The indicator is intended to indicate trend reversals, and works best in hourly charts (1h-2h-3h-4h).
The Seri Indicator is easy to interpret, which was one of the design goals. If the Fast Moving Average (Green Line) crosses ABOVE the Slow Moving Average (Red Line), it indicates a BULLISH Trend, therefore a BUY SIGNAL. If the Fast Moving Average (Green Line) crosses BELOW the Slow Moving Average (Red Line), it indicates a BEARISH trend, therefore a SELL SIGNAL. The indicator is in development phase so it is natural for it to give faulty signals, so it is good practice to use it on a longer-term chart than the intended one (Use 2h chart for hourly trades etc.).
Any suggestions for improvements are highly welcome!
Phát hành các Ghi chú
This is a Moving Average based indicator that is inspired by the MACD indicator. The indicator is intended to indicate trend reversals, and works best in hourly charts (1h-2h-3h-4h).The Seri Indicator is easy to interpret, which was one of the design goals. If the Fast Moving Average (Green Line) crosses ABOVE the Slow Moving Average (Red Line), it indicates a BULLISH Trend, therefore a BUY SIGNAL. If the Fast Moving Average (Green Line) crosses BELOW the Slow Moving Average (Red Line), it indicates a BEARISH trend, therefore a SELL SIGNAL. The indicator is in development phase so it is natural for it to give faulty signals, so it is good practice to use it on a longer-term chart than the intended one (Use 2h chart for hourly trades etc.).
The current version is 0.2. The indicator is still in alpha/testing phase therefore is not market-ready for big amounts of investment.
Any suggestions for improvements are highly welcome!
Mã nguồn mở
Theo đúng tinh thần TradingView, tác giả của tập lệnh này đã công bố nó dưới dạng mã nguồn mở, để các nhà giao dịch có thể xem xét và xác minh chức năng. Chúc mừng tác giả! Mặc dù bạn có thể sử dụng miễn phí, hãy nhớ rằng việc công bố lại mã phải tuân theo Nội quy.
Thông báo miễn trừ trách nhiệm
Thông tin và các ấn phẩm này không nhằm mục đích, và không cấu thành, lời khuyên hoặc khuyến nghị về tài chính, đầu tư, giao dịch hay các loại khác do TradingView cung cấp hoặc xác nhận. Đọc thêm tại Điều khoản Sử dụng.