OPEN-SOURCE SCRIPT
Adjustable Correction from ATH Signal
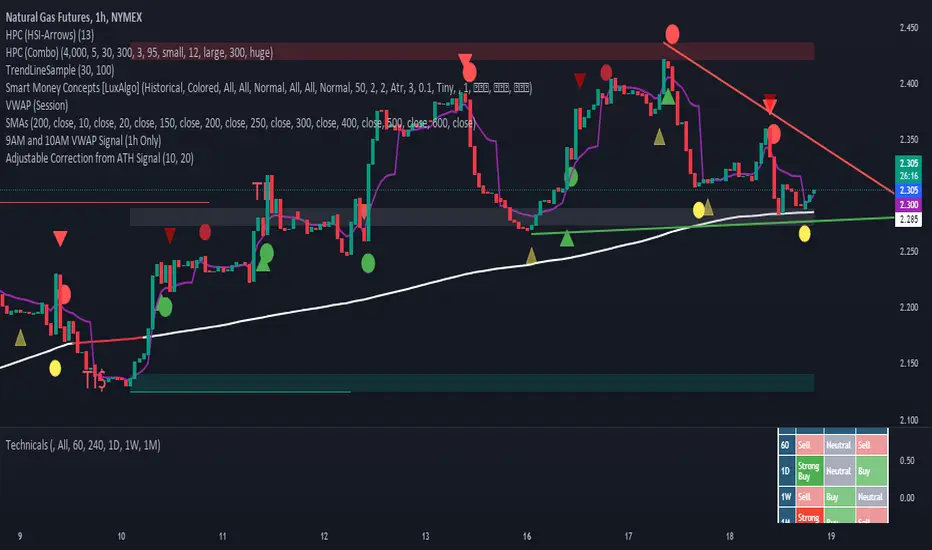
A "Correction Signal from All-Time High" is an indicator used to identify potential reversals or pullbacks in an asset's price after it has reached its highest historical level, known as an all-time high (ATH). This signal typically occurs when the price begins to decline after hitting the ATH, suggesting a correction phase where the asset retraces part of its upward movement.
Key elements of this signal include:
Overbought Conditions: The asset may have experienced a strong rally leading to an overbought condition, where the price could be considered too high relative to recent trends.
Reversal Patterns: The correction signal is often accompanied by technical patterns or indicators that suggest a reversal, such as bearish candlestick formations, negative divergence in momentum indicators, or moving average crossovers.
Percentage Decline: A correction is generally defined as a price drop of at least 10% from the ATH, although smaller pullbacks may also signal potential market shifts.
Volume Analysis: Increased selling volume after the ATH can validate the correction signal, indicating that more market participants are taking profits or exiting positions.
This signal helps traders and investors anticipate periods of market consolidation or potential downturns after significant price advances, allowing for better risk management or entry points for new positions.
Mã nguồn mở
Theo đúng tinh thần TradingView, tác giả của tập lệnh này đã công bố nó dưới dạng mã nguồn mở, để các nhà giao dịch có thể xem xét và xác minh chức năng. Chúc mừng tác giả! Mặc dù bạn có thể sử dụng miễn phí, hãy nhớ rằng việc công bố lại mã phải tuân theo Nội quy.
Thông báo miễn trừ trách nhiệm
Thông tin và các ấn phẩm này không nhằm mục đích, và không cấu thành, lời khuyên hoặc khuyến nghị về tài chính, đầu tư, giao dịch hay các loại khác do TradingView cung cấp hoặc xác nhận. Đọc thêm tại Điều khoản Sử dụng.