OPEN-SOURCE SCRIPT
Gamma Blast Detector (Nifty)
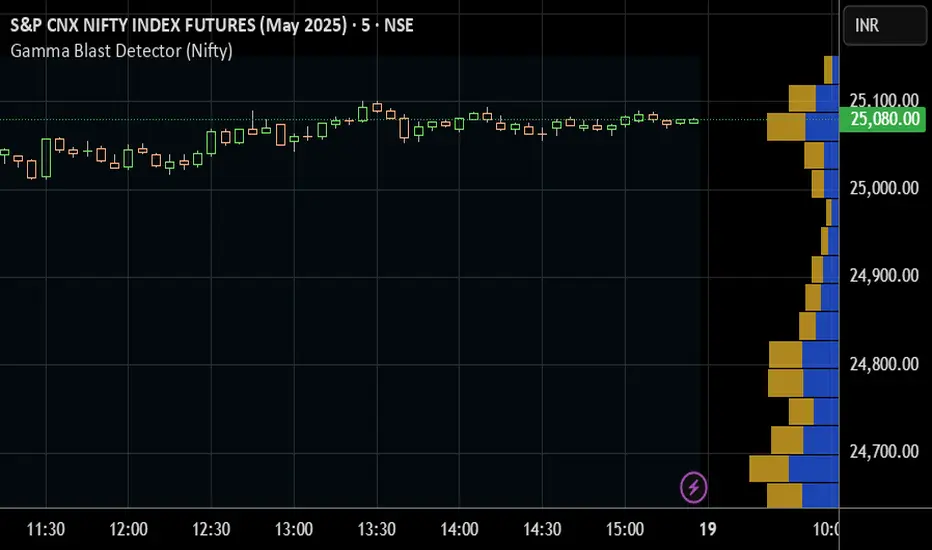
The Gamma Blast Detector (Nifty) is a custom TradingView indicator designed to help intraday traders identify sudden and explosive price movements—commonly referred to as "gamma blasts"—in the Nifty index during the final minutes of the trading session, particularly on expiry days. These movements are typically caused by rapid delta changes in ATM options, resulting in aggressive short-covering or option unwinding.
This indicator specifically monitors price action between 3:10 PM and 3:20 PM IST, which translates to 09:40 AM to 09:50 AM UTC on TradingView. It is optimized for use on 5-minute charts of the Nifty spot or futures index, where gamma-driven volatility is most likely to occur during this time window.
The core logic behind the indicator involves identifying unusually large candles within this time frame. It compares the size of the current candle to the average size of the previous five candles. If the current candle is at least twice as large and shows clear direction (bullish or bearish), the script flags it as a potential gamma blast. A bullish candle suggests a Call Option (CE) is likely to blast upward, while a bearish candle points to a Put Option (PE) gaining sharply.
When such a condition is detected, the indicator visually marks the candle on the chart: a "CE 🚀" label is shown below the candle for a bullish move, and a "PE 🔻" label appears above for a bearish move. It also includes alert conditions, allowing users to set real-time alerts for potential blasts and act quickly.
This tool is especially useful for expiry day scalpers, option traders, and anyone looking to ride momentum generated by gamma effects in the final minutes of the market. It provides a visual and alert-based edge to anticipate short-term, high-impact moves often missed in normal technical analysis.
Mã nguồn mở
Theo đúng tinh thần TradingView, tác giả của tập lệnh này đã công bố nó dưới dạng mã nguồn mở, để các nhà giao dịch có thể xem xét và xác minh chức năng. Chúc mừng tác giả! Mặc dù bạn có thể sử dụng miễn phí, hãy nhớ rằng việc công bố lại mã phải tuân theo Nội quy.
Thông báo miễn trừ trách nhiệm
Thông tin và các ấn phẩm này không nhằm mục đích, và không cấu thành, lời khuyên hoặc khuyến nghị về tài chính, đầu tư, giao dịch hay các loại khác do TradingView cung cấp hoặc xác nhận. Đọc thêm tại Điều khoản Sử dụng.