OPEN-SOURCE SCRIPT
Cập nhật Low and High Values [Alorse]
🌟 What does this indicator do?
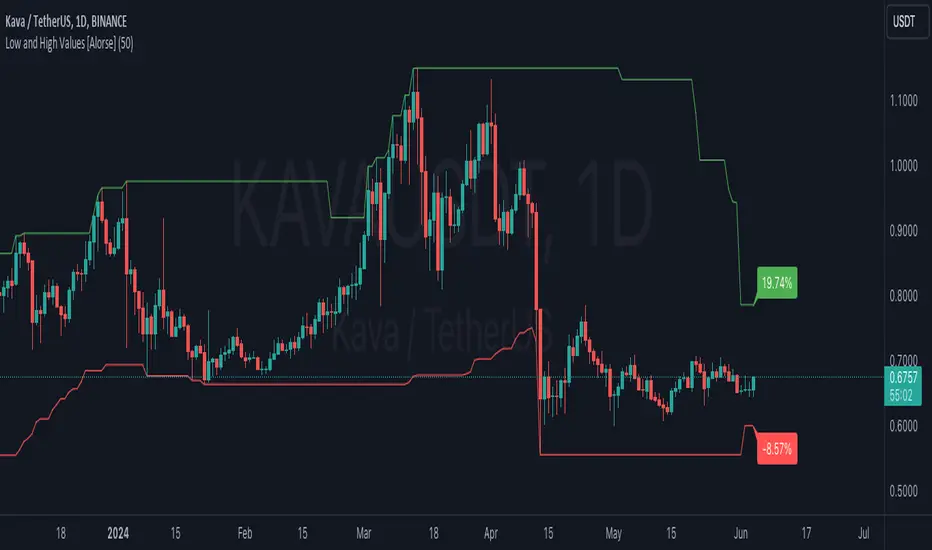
This magical indicator shows you the lowest (Low) and highest (High) values of the last X candles directly on your chart. Not only that, but it also tells you how much the price has changed from the opening price of the current candle to these key points, all in percentage format. You'll have a clear and precise view of market movement!
🔧 Customize to your liking
Want to adjust the number of candles to consider? No problem! You can easily change this parameter to suit your preference. Whether you like short-term strategies with just a few candles or prefer more extensive analysis with many candles, our indicator adapts to you.
🚀 How can this indicator help you?
📊 Examples of Use
🛠️ Customizable Parameters
This magical indicator shows you the lowest (Low) and highest (High) values of the last X candles directly on your chart. Not only that, but it also tells you how much the price has changed from the opening price of the current candle to these key points, all in percentage format. You'll have a clear and precise view of market movement!
🔧 Customize to your liking
Want to adjust the number of candles to consider? No problem! You can easily change this parameter to suit your preference. Whether you like short-term strategies with just a few candles or prefer more extensive analysis with many candles, our indicator adapts to you.
🚀 How can this indicator help you?
- Identify Support and Resistance: By showing the lowest and highest points, it helps you identify key support and resistance levels. Perfect for planning your entries and exits!
- Trend Analysis: With the percentage labels, you can quickly see how the price has moved relative to recent extremes, helping you confirm trends or anticipate possible reversals.
- Trading Strategies: Imagine the price is near a recent low, but the percentage indicates a significant drop from the opening. This could be a buy signal if you expect a rebound. Conversely, if the price is near a recent high with a large percentage increase, you might consider selling.
- Calculate Stop Loss: Use this indicator to determine your Stop Loss levels by leaving a bit of margin between the indicator value and your desired SL. This helps protect your positions while allowing for some price fluctuation.
📊 Examples of Use
- Intraday Trader: Use the indicator with 10-20 candles to capture quick moves and capitalize on daily fluctuations.
- Mid-term Trader: Set the indicator to consider 50 candles for a broader view of trends and reversal points.
- Long-term Strategist: Adjust the indicator to 100 candles or more to identify highs and lows over larger time frames.
🛠️ Customizable Parameters
- Number of Candles: Define the number of candles the indicator will analyze to calculate the lowest and highest values. It's all up to you!
Phát hành các Ghi chú
🌟 What does this indicator do?Our magical indicator shows you the lowest (Low) and highest (High) values of the last X candles directly on your chart. Not only that, but it also tells you how much the price has changed from the opening price of the current candle to these key points, all in percentage format. You'll have a clear and precise view of market movement!
🔧 Customize to your liking
Want to adjust the number of candles to consider? No problem! You can easily change this parameter to suit your preference. Whether you like short-term strategies with just a few candles or prefer more extensive analysis with many candles, our indicator adapts to you.
🚀 How can this indicator help you?
- Identify Support and Resistance: By showing the lowest and highest points, it helps you identify key support and resistance levels. Perfect for planning your entries and exits!
- Trend Analysis: With the percentage labels, you can quickly see how the price has moved relative to recent extremes, helping you confirm trends or anticipate possible reversals.
- Trading Strategies: Imagine the price is near a recent low, but the percentage indicates a significant drop from the opening. This could be a buy signal if you expect a rebound. Conversely, if the price is near a recent high with a large percentage increase, you might consider selling.
- Calculate Stop Loss: Use this indicator to determine your Stop Loss levels by leaving a bit of margin between the indicator value and your desired SL. This helps protect your positions while allowing for some price fluctuation.
- Tooltips for Precision: Now with added tooltips on the labels, you can hover your mouse over the percentage labels to see the exact price value at that point. This provides an extra layer of precision for your analysis and decision-making.
📊 Examples of Use
- Intraday Trader: Use the indicator with 10-20 candles to capture quick moves and capitalize on daily fluctuations.
- Mid-term Trader: Set the indicator to consider 50 candles for a broader view of trends and reversal points.
- Long-term Strategist: Adjust the indicator to 100 candles or more to identify highs and lows over larger time frames.
🛠️ Customizable Parameters
- Number of Candles: Define the number of candles the indicator will analyze to calculate the lowest and highest values. It's all up to you!
📋 Clean and Clear Chart
To enhance your trading experience, we've also eliminated other indicators from the chart in this version. This ensures a clutter-free, easy-to-read display focused solely on the crucial low and high values.
Mã nguồn mở
Theo đúng tinh thần TradingView, tác giả của tập lệnh này đã công bố nó dưới dạng mã nguồn mở, để các nhà giao dịch có thể xem xét và xác minh chức năng. Chúc mừng tác giả! Mặc dù bạn có thể sử dụng miễn phí, hãy nhớ rằng việc công bố lại mã phải tuân theo Nội Quy.
Thông báo miễn trừ trách nhiệm
Thông tin và các ấn phẩm này không nhằm mục đích, và không cấu thành, lời khuyên hoặc khuyến nghị về tài chính, đầu tư, giao dịch hay các loại khác do TradingView cung cấp hoặc xác nhận. Đọc thêm tại Điều khoản Sử dụng.