OPEN-SOURCE SCRIPT
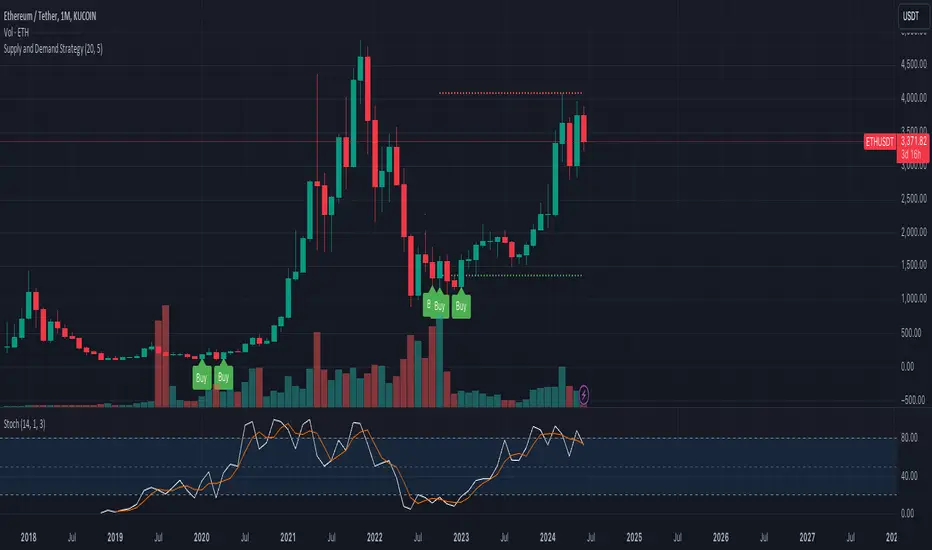
Supply and Demand Strategy

Overview
This strategy is designed to identify key supply (resistance) and demand (support) zones on a price chart. These zones represent areas where the price has historically shown a significant reaction, either bouncing up from a demand zone or dropping down from a supply zone. The strategy provides clear entry and exit points for trades based on these zones.
Key Components
Supply and Demand Zones:
Supply Zone: An area where the price has reversed from an uptrend to a downtrend. It represents a high concentration of sellers.
Demand Zone: An area where the price has reversed from a downtrend to an uptrend. It represents a high concentration of buyers.
Time Frames:
Use higher time frames (like daily or weekly) to identify key supply and demand zones.
Use lower time frames (like 1-hour or 4-hour) to pinpoint precise entry and exit points within these zones.
Confirmation:
Use price action and candlestick patterns (like pin bars or engulfing patterns) to confirm potential reversals in these zones.
Mã nguồn mở
Theo đúng tinh thần TradingView, tác giả của tập lệnh này đã công bố nó dưới dạng mã nguồn mở, để các nhà giao dịch có thể xem xét và xác minh chức năng. Chúc mừng tác giả! Mặc dù bạn có thể sử dụng miễn phí, hãy nhớ rằng việc công bố lại mã phải tuân theo Nội quy.
Thông báo miễn trừ trách nhiệm
Thông tin và các ấn phẩm này không nhằm mục đích, và không cấu thành, lời khuyên hoặc khuyến nghị về tài chính, đầu tư, giao dịch hay các loại khác do TradingView cung cấp hoặc xác nhận. Đọc thêm tại Điều khoản Sử dụng.