OPEN-SOURCE SCRIPT
The Bounded Slope Indicator
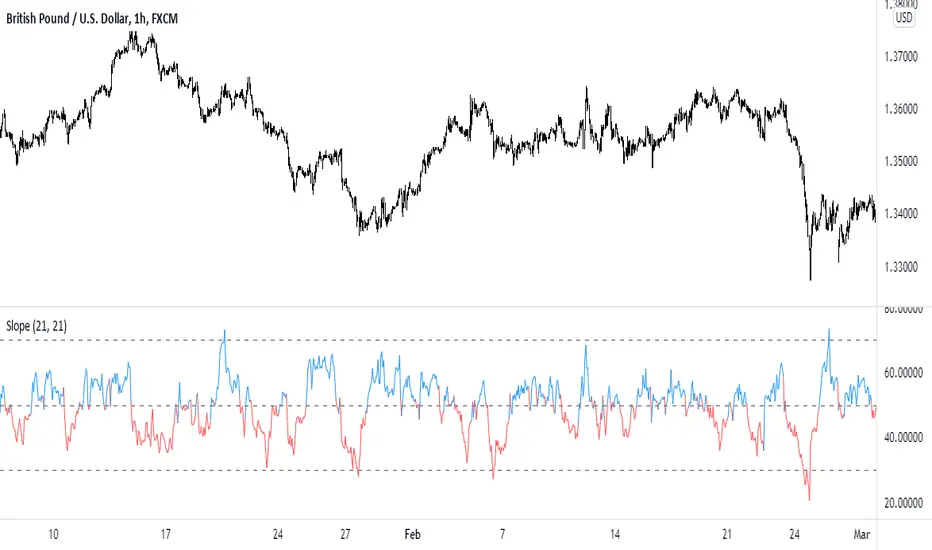
This indicator uses the concept of slopes and normalizes the values so that they are bounded between 0 and 100. The steps required to calculate the indicator are as follows:
* Calculate the slope of the price using a lookback period (by default, it is either 14 or 21). The slope is calculated by subtracting the current close price from the close price 21 (or 14) periods ago and dividing the result by 21 (or 14).
* Calculate the RSI of the slope calculations to get a normalized slope indicator.
The bounded slope indicator can be used the same way as the RSI:
* Through oversold and overbought levels. A bullish bias is present whenever the indicator is close to its oversold level (by default, it is 30) and a bearish bias is present whenever the indicator is close to its overbought level (by default, it is 70).
* Through the divergence technique. A bullish bias is present whenever the indicator is making higher lows and the market is making lower lows. A bearish bias is present whenever the indicator is making lower highs and the market is making higher highs.
The main advantage of the indicator is its different approach to measuring momentum which can be a good uncorrelated indicator to other classical ones (such as the stochastic oscillator and the MACD).
Mã nguồn mở
Theo đúng tinh thần TradingView, tác giả của tập lệnh này đã công bố nó dưới dạng mã nguồn mở, để các nhà giao dịch có thể xem xét và xác minh chức năng. Chúc mừng tác giả! Mặc dù bạn có thể sử dụng miễn phí, hãy nhớ rằng việc công bố lại mã phải tuân theo Nội quy.
Thông báo miễn trừ trách nhiệm
Thông tin và các ấn phẩm này không nhằm mục đích, và không cấu thành, lời khuyên hoặc khuyến nghị về tài chính, đầu tư, giao dịch hay các loại khác do TradingView cung cấp hoặc xác nhận. Đọc thêm tại Điều khoản Sử dụng.