OPEN-SOURCE SCRIPT
Cập nhật Quantum Flow Tracker
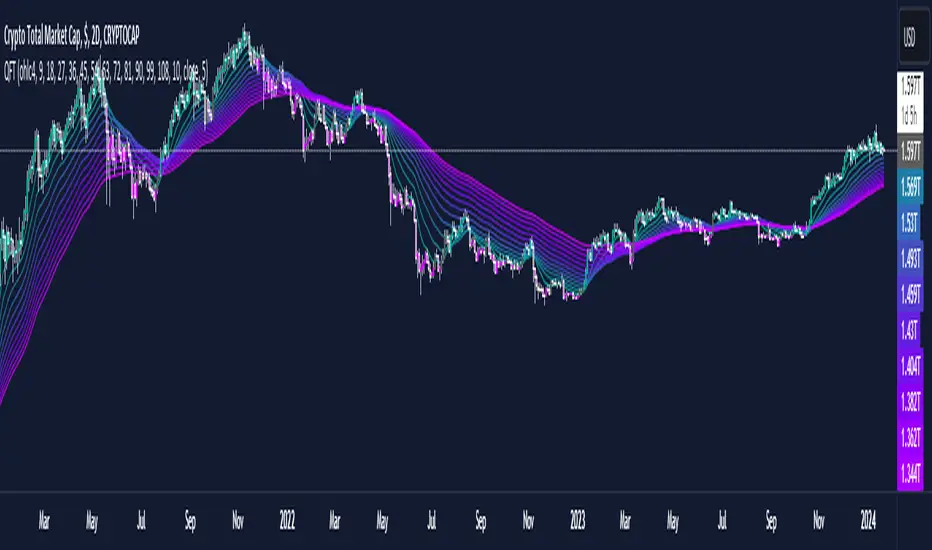
This indicator is designed to capture trends in financial markets by utilizing an Exponential Moving Average (EMA) and the Relative Strength Index (RSI).
Multiple EMAs
The indicator plots multiple EMAs with varying lengths on the chart. Users can customize the lengths of these EMAs using the input parameters.
RSI (Relative Strength Index)
The RSI is calculated based on user-defined length and source inputs.
Additionally, the RSI is smoothed using an Exponential Moving Average (EMA) with a customizable length.
Trend Conditions
The indicator defines uptrend and downtrend conditions based on the relationship between the closing price, the first EMA and the EMA of RSI .
An uptrend (Green Color) is identified when the closing price is above ema1 and the smoothed RSI is above 50.
A downtrend (Purple Color) is identified when the closing price is below ema1 and the smoothed RSI is below 50.
A neutral state (Gray Color) suggests that the trend may be weakening, potentially indicating a forthcoming trend reversal or a period of indecision in the market.
This indicator provides a visual representation of trend directions and can be customized to adjust the sensitivity and frequency of trend changes.
Disclaimer: This indicator is provided for educational and informational purposes only.
It is not intended as financial advice or as a tool for making financial decisions.
Users are advised to conduct their own research and seek the advice of a qualified financial professional before making any investment decisions. The creator of this indicator is not responsible for any financial losses incurred as a result of using this indicator.
Phát hành các Ghi chú
Default values for the EMAs error changed.Mã nguồn mở
Theo đúng tinh thần TradingView, tác giả của tập lệnh này đã công bố nó dưới dạng mã nguồn mở, để các nhà giao dịch có thể xem xét và xác minh chức năng. Chúc mừng tác giả! Mặc dù bạn có thể sử dụng miễn phí, hãy nhớ rằng việc công bố lại mã phải tuân theo Nội quy.
🔍 Access Investing Strategies & Indicators
📊 whop.com/marktquant
🌐 marktquant.com
Nothing shared on this page constitutes financial advice. All information, tools, and analyses are provided solely for informational and educational purposes.
📊 whop.com/marktquant
🌐 marktquant.com
Nothing shared on this page constitutes financial advice. All information, tools, and analyses are provided solely for informational and educational purposes.
Thông báo miễn trừ trách nhiệm
Thông tin và các ấn phẩm này không nhằm mục đích, và không cấu thành, lời khuyên hoặc khuyến nghị về tài chính, đầu tư, giao dịch hay các loại khác do TradingView cung cấp hoặc xác nhận. Đọc thêm tại Điều khoản Sử dụng.
Mã nguồn mở
Theo đúng tinh thần TradingView, tác giả của tập lệnh này đã công bố nó dưới dạng mã nguồn mở, để các nhà giao dịch có thể xem xét và xác minh chức năng. Chúc mừng tác giả! Mặc dù bạn có thể sử dụng miễn phí, hãy nhớ rằng việc công bố lại mã phải tuân theo Nội quy.
🔍 Access Investing Strategies & Indicators
📊 whop.com/marktquant
🌐 marktquant.com
Nothing shared on this page constitutes financial advice. All information, tools, and analyses are provided solely for informational and educational purposes.
📊 whop.com/marktquant
🌐 marktquant.com
Nothing shared on this page constitutes financial advice. All information, tools, and analyses are provided solely for informational and educational purposes.
Thông báo miễn trừ trách nhiệm
Thông tin và các ấn phẩm này không nhằm mục đích, và không cấu thành, lời khuyên hoặc khuyến nghị về tài chính, đầu tư, giao dịch hay các loại khác do TradingView cung cấp hoặc xác nhận. Đọc thêm tại Điều khoản Sử dụng.