OPEN-SOURCE SCRIPT
SCPEM - Socionomic Crypto Peak Model (0-85 Scale)
SCPEM Indicator Overview
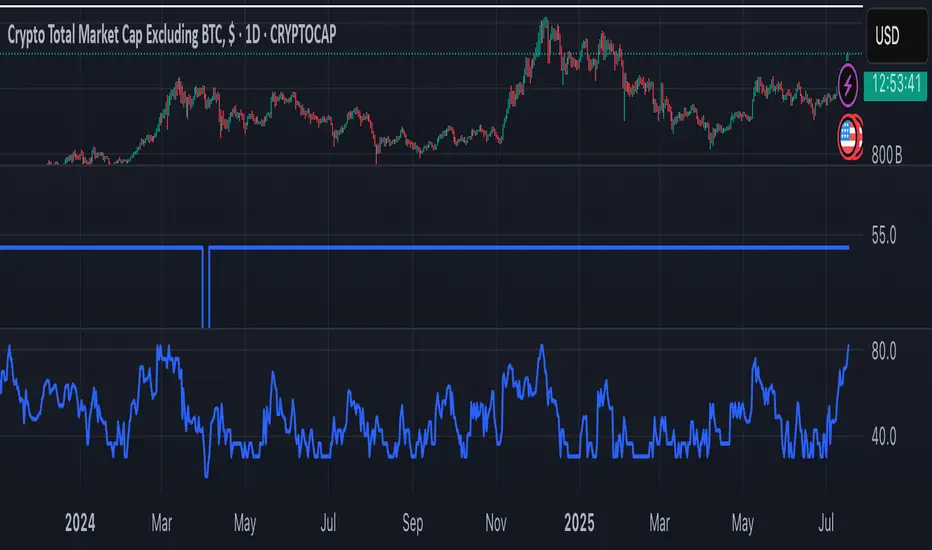
The SCPEM (Socionomic Crypto Peak Evaluation Model) indicator is a TradingView tool designed to approximate cycle peaks in cryptocurrency markets using socionomic theory, which links market behavior to collective social mood. It generates a score from 0-85 (where 85 signals extreme euphoria and high reversal risk) and plots it as a blue line on the chart for visual backtesting and real-time analysis.
#### How It Works
The indicator uses technical proxies to estimate social mood factors, as Pine Script cannot fetch external data like sentiment indices or social media directly. It calculates a weighted composite score on each bar:
- Proxies derive from price, volume, and volatility data.
- The raw sum of factor scores (max ~28) is normalized to 0-85.
- The score updates historically for backtesting, showing mood progression over time.
- Alerts trigger if the score exceeds 60, indicating high peak probability.
Users can adjust inputs (e.g., lengths for RSI or pivots) to fine-tune for different assets or timeframes.
Metrics Used (Technical Proxies)
Crypto-Specific Sentiment
Approximated by RSI (overbought levels indicate greed).
Social Media Euphoria
Based on volume relative to its SMA (spikes suggest herding/FOMO).
Broader Social Mood Proxies
Derived from ATR volatility (high values signal uncertain/mixed mood).
Search and Cultural Interest Proxied by OBV trend (rising accumulation implies growing interest).
Socionomic Wildcard
Uses Bollinger Band width (expansion for positive mood, contraction for negative).
Elliott Wave Position
Counts recent price pivots (more swings indicate later wave stages and exhaustion).
Mã nguồn mở
Theo đúng tinh thần TradingView, tác giả của tập lệnh này đã công bố nó dưới dạng mã nguồn mở, để các nhà giao dịch có thể xem xét và xác minh chức năng. Chúc mừng tác giả! Mặc dù bạn có thể sử dụng miễn phí, hãy nhớ rằng việc công bố lại mã phải tuân theo Nội quy.
Thông báo miễn trừ trách nhiệm
Thông tin và các ấn phẩm này không nhằm mục đích, và không cấu thành, lời khuyên hoặc khuyến nghị về tài chính, đầu tư, giao dịch hay các loại khác do TradingView cung cấp hoặc xác nhận. Đọc thêm tại Điều khoản Sử dụng.