OPEN-SOURCE SCRIPT
Cập nhật Histogram - Price Action - Dy Calculator
This script aims to help users of Price Action robot, for Smarttbot (brazilian site that automates Brazilian market (B3)).
You can use on any symbol.
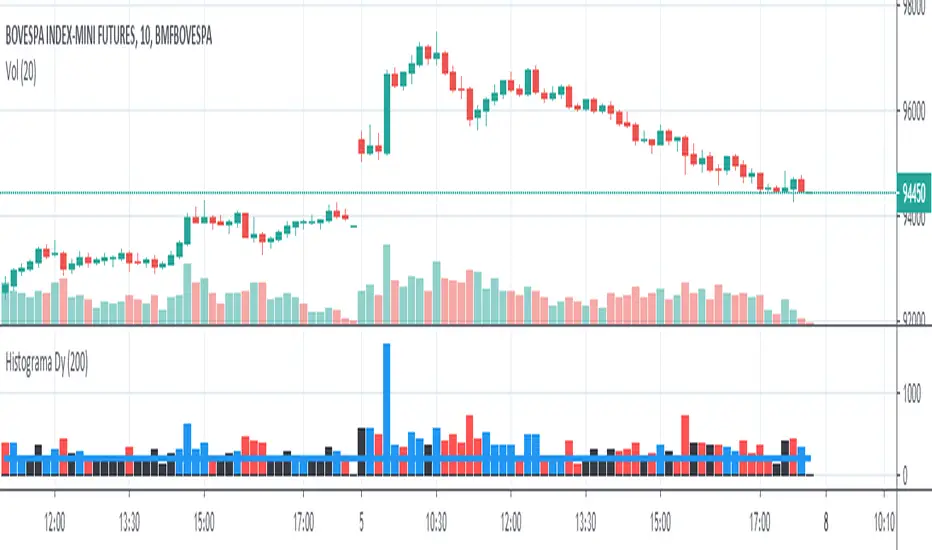
The script will follow price action principles. It will calculate the absolute value of last candle and compare with actual candle. Colors are:
- Red - If the actual candle absolute value is higher than previous one, and the price is lower than last candle. It would be a short entry.
- Blue - If the actual candle absolute value is higher than previous one, and the price is higher than last candle. It would be a long entry.
- Black - The actual candle absolute value is lower than previous one, so there is no entry.
If there is a candle that is higher than previous one, and both high and low values are outside boundaries of previous one, it will calculate which boundary is bigger and will apply the collor accordingly.
You can use on any symbol.
The script will follow price action principles. It will calculate the absolute value of last candle and compare with actual candle. Colors are:
- Red - If the actual candle absolute value is higher than previous one, and the price is lower than last candle. It would be a short entry.
- Blue - If the actual candle absolute value is higher than previous one, and the price is higher than last candle. It would be a long entry.
- Black - The actual candle absolute value is lower than previous one, so there is no entry.
If there is a candle that is higher than previous one, and both high and low values are outside boundaries of previous one, it will calculate which boundary is bigger and will apply the collor accordingly.
Phát hành các Ghi chú
V4 - Better candle rupture detection, now it only marks as a rupture when last candle price (high-low) is bigger than dy and it had a rupture.Mã nguồn mở
Theo đúng tinh thần TradingView, tác giả của tập lệnh này đã công bố nó dưới dạng mã nguồn mở, để các nhà giao dịch có thể xem xét và xác minh chức năng. Chúc mừng tác giả! Mặc dù bạn có thể sử dụng miễn phí, hãy nhớ rằng việc công bố lại mã phải tuân theo Nội quy.
Thông báo miễn trừ trách nhiệm
Thông tin và các ấn phẩm này không nhằm mục đích, và không cấu thành, lời khuyên hoặc khuyến nghị về tài chính, đầu tư, giao dịch hay các loại khác do TradingView cung cấp hoặc xác nhận. Đọc thêm tại Điều khoản Sử dụng.
Mã nguồn mở
Theo đúng tinh thần TradingView, tác giả của tập lệnh này đã công bố nó dưới dạng mã nguồn mở, để các nhà giao dịch có thể xem xét và xác minh chức năng. Chúc mừng tác giả! Mặc dù bạn có thể sử dụng miễn phí, hãy nhớ rằng việc công bố lại mã phải tuân theo Nội quy.
Thông báo miễn trừ trách nhiệm
Thông tin và các ấn phẩm này không nhằm mục đích, và không cấu thành, lời khuyên hoặc khuyến nghị về tài chính, đầu tư, giao dịch hay các loại khác do TradingView cung cấp hoặc xác nhận. Đọc thêm tại Điều khoản Sử dụng.