OPEN-SOURCE SCRIPT
Anand Bollinger Bands - Linear Regression Slope
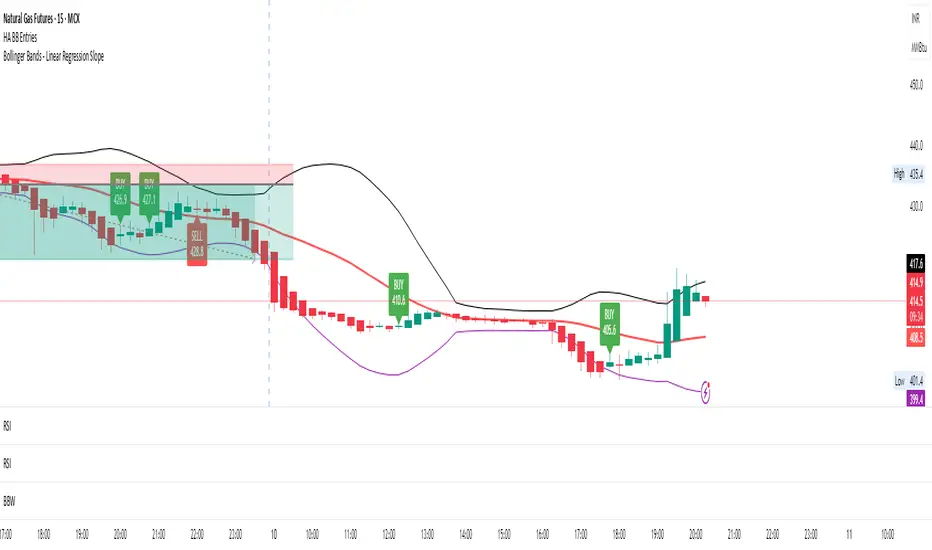
Summary
Bollinger Bands show price volatility using SMA ± standard deviation
Linear Regression calculates the mathematical trend through the middle line
Slope comparison (current vs. previous) determines if trend is rising or falling
Color changes based on that trend: Green = up, Red = down
Uses same period for both BB and slope = everything stays synchronized
The result: A visual indicator that shows you not just where price is relative to volatility, but also which direction the trend is actually moving!
Mã nguồn mở
Theo đúng tinh thần TradingView, tác giả của tập lệnh này đã công bố nó dưới dạng mã nguồn mở, để các nhà giao dịch có thể xem xét và xác minh chức năng. Chúc mừng tác giả! Mặc dù bạn có thể sử dụng miễn phí, hãy nhớ rằng việc công bố lại mã phải tuân theo Nội quy.
Thông báo miễn trừ trách nhiệm
Thông tin và các ấn phẩm này không nhằm mục đích, và không cấu thành, lời khuyên hoặc khuyến nghị về tài chính, đầu tư, giao dịch hay các loại khác do TradingView cung cấp hoặc xác nhận. Đọc thêm tại Điều khoản Sử dụng.