OPEN-SOURCE SCRIPT
ADX + DMI (HMA Version)
📝 Description (What This Indicator Does)
🚀 ADX + DMI (HMA Version) is a trend strength oscillator that enhances the traditional ADX by using the Hull Moving Average (HMA) instead of EMA.
✅ This results in a much faster and more responsive trend detection while filtering out choppy price action.
🎯 What This Indicator Does:
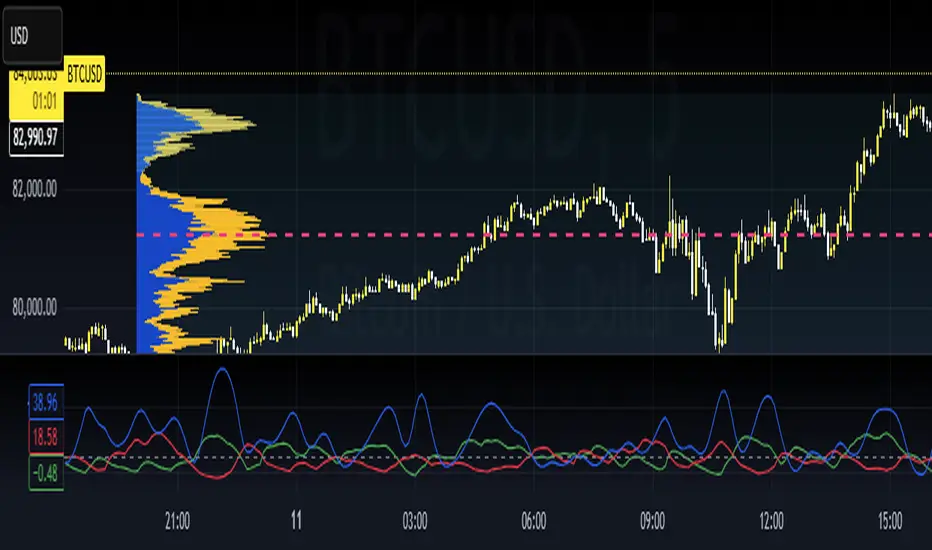
1️⃣ Measures Trend Strength – ADX shows when a trend is strong or weak.
2️⃣ Identifies Trend Direction – DI+ (Green) shows bullish momentum, DI- (Red) shows bearish momentum.
3️⃣ Uses Hull Moving Average (HMA) for Faster Signals – Removes lag and reacts faster to trend changes.
4️⃣ Reduces False Signals – Traditional ADX lags behind, but this version reacts quickly to reversals.
5️⃣ Good for Scalping & Day Trading – Especially for BTC 5-min and lower timeframes.
⚙ Indicator Inputs (Customization)
Input Name Example Value Purpose
ADX Length 14 Defines the smoothing for the ADX value.
DI Length 14 Defines how DI+ and DI- are calculated.
HMA Length 24 Hull Moving Average smoothing for ADX & DI+.
Trend Threshold 25 The level above which ADX confirms a strong trend.
📌 You can adjust these settings to optimize for different assets and timeframes.
🎯 Trading Rules & How to Use It
✅ How to Identify a Strong Trend:
When ADX (Blue Line) is above 25→ A strong trend is in play.
When ADX is below 25 → The market is choppy or ranging.
✅ How to Use DI+ and DI- for Trend Direction:
If DI+ (Green) is above DI- (Red), the market is in an uptrend.
If DI- (Red) is above DI+ (Green), the market is in a downtrend.
✅ How to Confirm Entries & Exits:
1️⃣ Enter Long when DI+ crosses above DI- while ADX is rising above 25.
2️⃣ Enter Short when DI- crosses above DI+ while ADX is rising above 25.
3️⃣ Avoid trading when ADX is below 25 – the market is in a choppy range.
This should not be used as a stand alone oscillator. Trading takes skill and is risky. Use at your own risk.
This is not advise on how to trade, these are just examples of how I use the oscillator. Trade at your own risk.
You can put this on your chart versus the tradingview adx and you can adjust the settings to see the difference. This was optimized for btc on the 5 min chart. You can adjust for your trading strategy.
🚀 ADX + DMI (HMA Version) is a trend strength oscillator that enhances the traditional ADX by using the Hull Moving Average (HMA) instead of EMA.
✅ This results in a much faster and more responsive trend detection while filtering out choppy price action.
🎯 What This Indicator Does:
1️⃣ Measures Trend Strength – ADX shows when a trend is strong or weak.
2️⃣ Identifies Trend Direction – DI+ (Green) shows bullish momentum, DI- (Red) shows bearish momentum.
3️⃣ Uses Hull Moving Average (HMA) for Faster Signals – Removes lag and reacts faster to trend changes.
4️⃣ Reduces False Signals – Traditional ADX lags behind, but this version reacts quickly to reversals.
5️⃣ Good for Scalping & Day Trading – Especially for BTC 5-min and lower timeframes.
⚙ Indicator Inputs (Customization)
Input Name Example Value Purpose
ADX Length 14 Defines the smoothing for the ADX value.
DI Length 14 Defines how DI+ and DI- are calculated.
HMA Length 24 Hull Moving Average smoothing for ADX & DI+.
Trend Threshold 25 The level above which ADX confirms a strong trend.
📌 You can adjust these settings to optimize for different assets and timeframes.
🎯 Trading Rules & How to Use It
✅ How to Identify a Strong Trend:
When ADX (Blue Line) is above 25→ A strong trend is in play.
When ADX is below 25 → The market is choppy or ranging.
✅ How to Use DI+ and DI- for Trend Direction:
If DI+ (Green) is above DI- (Red), the market is in an uptrend.
If DI- (Red) is above DI+ (Green), the market is in a downtrend.
✅ How to Confirm Entries & Exits:
1️⃣ Enter Long when DI+ crosses above DI- while ADX is rising above 25.
2️⃣ Enter Short when DI- crosses above DI+ while ADX is rising above 25.
3️⃣ Avoid trading when ADX is below 25 – the market is in a choppy range.
This should not be used as a stand alone oscillator. Trading takes skill and is risky. Use at your own risk.
This is not advise on how to trade, these are just examples of how I use the oscillator. Trade at your own risk.
You can put this on your chart versus the tradingview adx and you can adjust the settings to see the difference. This was optimized for btc on the 5 min chart. You can adjust for your trading strategy.
Mã nguồn mở
Theo đúng tinh thần TradingView, tác giả của tập lệnh này đã công bố nó dưới dạng mã nguồn mở, để các nhà giao dịch có thể xem xét và xác minh chức năng. Chúc mừng tác giả! Mặc dù bạn có thể sử dụng miễn phí, hãy nhớ rằng việc công bố lại mã phải tuân theo Nội quy.
Thông báo miễn trừ trách nhiệm
Thông tin và các ấn phẩm này không nhằm mục đích, và không cấu thành, lời khuyên hoặc khuyến nghị về tài chính, đầu tư, giao dịch hay các loại khác do TradingView cung cấp hoặc xác nhận. Đọc thêm tại Điều khoản Sử dụng.