OPEN-SOURCE SCRIPT
HPDR Bands Indicator

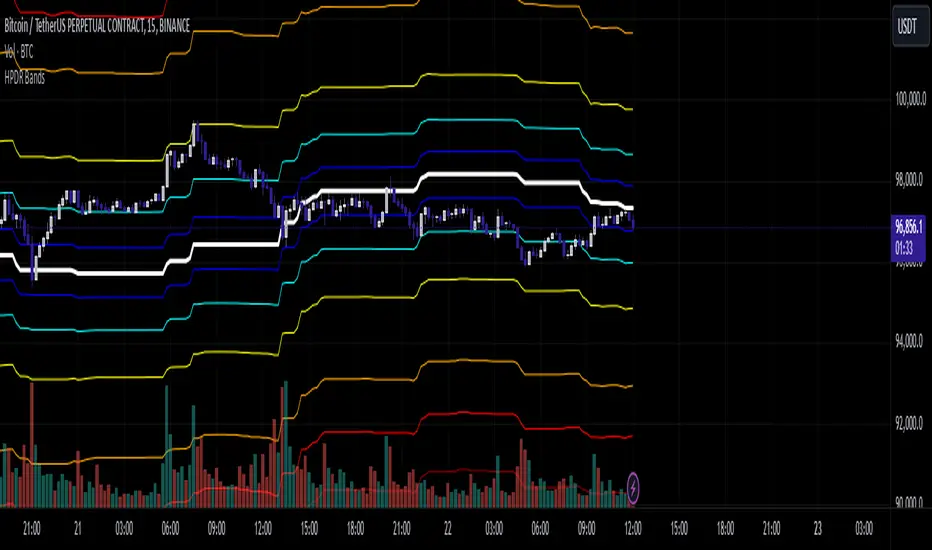
The HPDR Bands indicator is a customizable tool designed to help traders visualize dynamic price action zones. By combining historical price ranges with adaptive bands, this script provides clear insights into potential support, resistance, and midline levels. The indicator is well-suited for all trading styles, including trend-following and range-bound strategies.
Features:
How to Use:
Important Notes:
This script is not intended as investment advice. It is a tool to assist with market analysis and should be used alongside proper risk management and other trading tools.
The script is provided as-is and without warranty. Users are encouraged to backtest and validate its suitability for their specific trading needs.
Happy Trading!
If you find this script helpful, consider sharing your feedback or suggestions for improvement. Collaboration strengthens the TradingView community, and your input is always appreciated!
Features:
- Dynamic Price Bands: Calculates price zones based on historical highs and lows, blending long-term and short-term price data for responsive adaptation to current market conditions.
- Probability Enhancements: Includes a probability plot derived from the relative position of the closing price within the range, adjusted for volatility to highlight potential price movement scenarios.
- Fibonacci-Like Levels: Highlights key levels (100%, 95%, 88%, 78%, 61%, 50%, and 38%) for intuitive visualization of price zones, aiding in identifying high-probability trading opportunities.
- Midline Visualization: Displays a midline that serves as a reference for price mean reversion or breakout analysis.
How to Use:
- Trending Markets: Use the adaptive upper and lower bands to gauge potential breakout or retracement zones.
- Range-Bound Markets: Identify support and resistance levels within the defined price range.
- Volatility Analysis: Observe the probability plot and its sensitivity to volatility for informed decision-making.
Important Notes:
This script is not intended as investment advice. It is a tool to assist with market analysis and should be used alongside proper risk management and other trading tools.
The script is provided as-is and without warranty. Users are encouraged to backtest and validate its suitability for their specific trading needs.
Happy Trading!
If you find this script helpful, consider sharing your feedback or suggestions for improvement. Collaboration strengthens the TradingView community, and your input is always appreciated!
Mã nguồn mở
Theo đúng tinh thần TradingView, tác giả của tập lệnh này đã công bố nó dưới dạng mã nguồn mở, để các nhà giao dịch có thể xem xét và xác minh chức năng. Chúc mừng tác giả! Mặc dù bạn có thể sử dụng miễn phí, hãy nhớ rằng việc công bố lại mã phải tuân theo Nội quy.
Thông báo miễn trừ trách nhiệm
Thông tin và các ấn phẩm này không nhằm mục đích, và không cấu thành, lời khuyên hoặc khuyến nghị về tài chính, đầu tư, giao dịch hay các loại khác do TradingView cung cấp hoặc xác nhận. Đọc thêm tại Điều khoản Sử dụng.