OPEN-SOURCE SCRIPT
Cập nhật Buy and Sell Signals Based on SMI {K28}
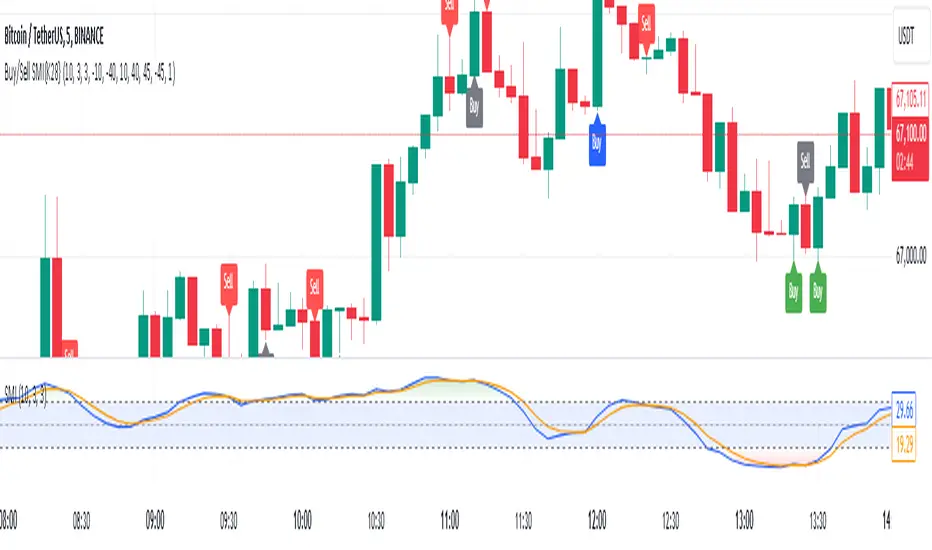
Buy/Sell Signals Based on SMI
This indicator provides buy and sell signals based on the Stochastic Momentum Index (SMI) to assist traders in identifying potential entry and exit points in the market. Here’s how to effectively use this indicator:
Usage Instructions:
Signal Interpretation:
No signal is 100% guaranteed
Green Labels: Indicate strong buy signals when the SMI crosses above its EMA, especially if the candle is green (closing price higher than opening price).
Red Labels: Indicate strong sell signals when the SMI crosses below its EMA.
Cautious Signals:
Blue Buy Labels: These buy signals appear when the SMI is in a cautious zone (between -20 and 20). They may not be as reliable, so confirm these signals with other indicators before acting.
Yellow Sell Labels: These buy signals appear when the SMI is in a cautious zone (between -20 and 20). They may not be as reliable, so confirm these signals with other indicators before acting.
Gray Buy and Sell Labels: Indicate potential false signals (when the SMI is overbought or oversold). Use other confirmation indicators to verify these signals.
Trade Strategy:
This indicator is designed for traders looking to make small, consistent profits. Focus on executing more trades rather than waiting for larger price movements.
Be mindful that the indicator may yield frequent signals, so it's essential to maintain discipline and only take trades that meet your criteria for confirmation.
Important Notes:
Caution with Signals: Always exercise caution when acting on blue or gray labels. These may indicate less reliable signals, so it's crucial to confirm with additional indicators.
No Perfect Indicator: Please remember that no trading indicator is perfect. Use this indicator at your own risk, and consider incorporating risk management strategies into your trading plan.
Conclusion:
By employing this SMI indicator, you can enhance your trading strategy focused on generating small, consistent profits through frequent trades. However, always verify signals and stay aware of market conditions to optimize your trading performance.
Phát hành các Ghi chú
Additional NoteThis indicator is most effective in trending stocks, where clear uptrends or downtrends are present. It may produce false signals in sideways or range-bound markets, so be cautious and look for strong directional movement to increase the accuracy of signals.
Phát hành các Ghi chú
Few fixesMã nguồn mở
Theo đúng tinh thần TradingView, tác giả của tập lệnh này đã công bố nó dưới dạng mã nguồn mở, để các nhà giao dịch có thể xem xét và xác minh chức năng. Chúc mừng tác giả! Mặc dù bạn có thể sử dụng miễn phí, hãy nhớ rằng việc công bố lại mã phải tuân theo Nội quy.
Thông báo miễn trừ trách nhiệm
Thông tin và các ấn phẩm này không nhằm mục đích, và không cấu thành, lời khuyên hoặc khuyến nghị về tài chính, đầu tư, giao dịch hay các loại khác do TradingView cung cấp hoặc xác nhận. Đọc thêm tại Điều khoản Sử dụng.
Mã nguồn mở
Theo đúng tinh thần TradingView, tác giả của tập lệnh này đã công bố nó dưới dạng mã nguồn mở, để các nhà giao dịch có thể xem xét và xác minh chức năng. Chúc mừng tác giả! Mặc dù bạn có thể sử dụng miễn phí, hãy nhớ rằng việc công bố lại mã phải tuân theo Nội quy.
Thông báo miễn trừ trách nhiệm
Thông tin và các ấn phẩm này không nhằm mục đích, và không cấu thành, lời khuyên hoặc khuyến nghị về tài chính, đầu tư, giao dịch hay các loại khác do TradingView cung cấp hoặc xác nhận. Đọc thêm tại Điều khoản Sử dụng.