OPEN-SOURCE SCRIPT
CCT Bollinger Band Oscillator
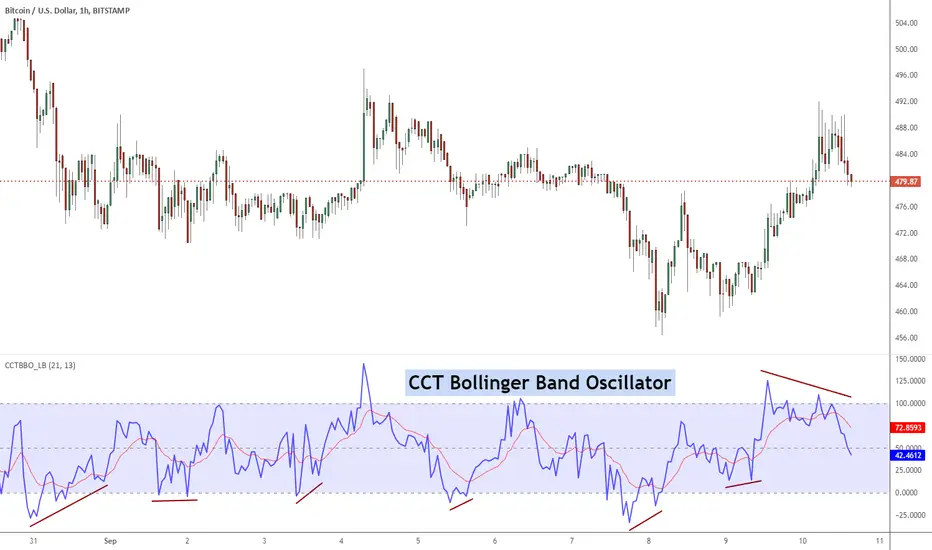
The CCT Bollinger Band Oscillator (CCTBO), developed by Steve Karnish of Cedar Creek Trading, reconfigures John Bollinger's classic Bollinger Bands (envelopes plotted at two Standard Deviations above and below a moving average) by drawing two parallel lines replacing the envelopes. The parallel lines represent a measurement of two Standard Deviations from the mean and are assigned a value of zero and 100 on the chart.
The indicator represents the price as it travels above and below the mean (50%) and outside the two standard deviations (zero and 100). Penetration of the upper band represents overbought conditions while penetration of the lower band signifies oversold conditions. Usage of the CCT Bollinger Band Oscillator to identify 'failure swings' and 'divergences' can lead to significant reversals.
List of my other indicators:
- Chart: tradingview.com/v/4IneGo8h/
- GDoc: docs.google.com/document/d/15AGCufJZ8CIUvwFJ9W-IKns88gkWOKBCvByMEvm5MLo/edit?usp=sharing
Mã nguồn mở
Theo đúng tinh thần TradingView, tác giả của tập lệnh này đã công bố nó dưới dạng mã nguồn mở, để các nhà giao dịch có thể xem xét và xác minh chức năng. Chúc mừng tác giả! Mặc dù bạn có thể sử dụng miễn phí, hãy nhớ rằng việc công bố lại mã phải tuân theo Nội quy.
List of my free indicators: bit.ly/1LQaPK8
List of my indicators at Appstore: blog.tradingview.com/?p=970
List of my indicators at Appstore: blog.tradingview.com/?p=970
Thông báo miễn trừ trách nhiệm
Thông tin và các ấn phẩm này không nhằm mục đích, và không cấu thành, lời khuyên hoặc khuyến nghị về tài chính, đầu tư, giao dịch hay các loại khác do TradingView cung cấp hoặc xác nhận. Đọc thêm tại Điều khoản Sử dụng.