OPEN-SOURCE SCRIPT
NQ YM Correlation 1 min data
Overview
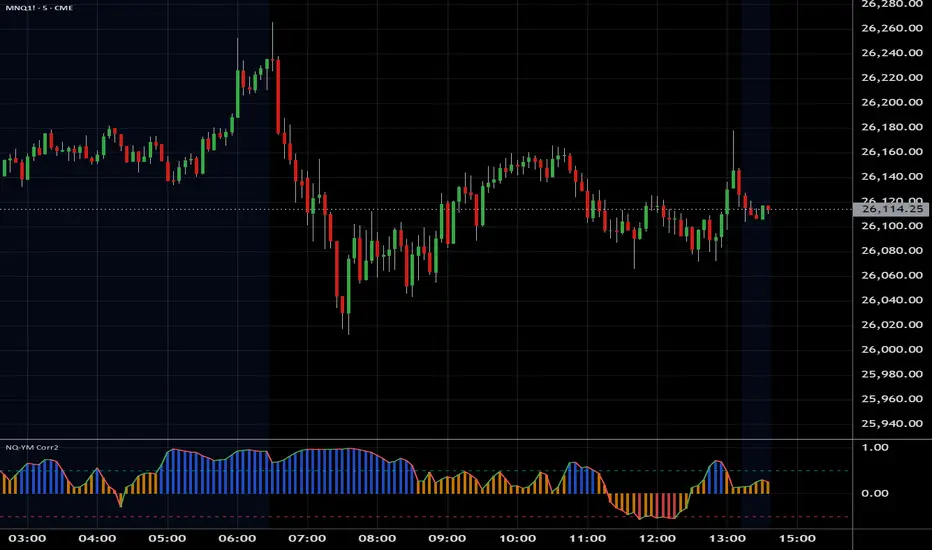
This indicator plots the correlation between Nasdaq 100 (NQ) and Dow Jones (YM) futures. It is specifically designed to act as an "Engine RPM" gauge for pairs traders who trade divergence or spread breakouts—not mean reversion.
To ensure consistent readings, this indicator always calculates using a 1-minute timeframe data, regardless of the chart timeframe you are currently viewing.
The core idea is:
High Correlation (Blue Zone): "Low RPM" or "Engine Idle." NQ and YM are moving together. The spread is flat. This is a no-trade zone.
Low Correlation (Red Zone): "High RPM" or "Engine Hot." NQ and YM are diverging. The spread is moving. This is the primary trade zone.
Mã nguồn mở
Theo đúng tinh thần TradingView, tác giả của tập lệnh này đã công bố nó dưới dạng mã nguồn mở, để các nhà giao dịch có thể xem xét và xác minh chức năng. Chúc mừng tác giả! Mặc dù bạn có thể sử dụng miễn phí, hãy nhớ rằng việc công bố lại mã phải tuân theo Nội quy.
Thông báo miễn trừ trách nhiệm
Thông tin và các ấn phẩm này không nhằm mục đích, và không cấu thành, lời khuyên hoặc khuyến nghị về tài chính, đầu tư, giao dịch hay các loại khác do TradingView cung cấp hoặc xác nhận. Đọc thêm tại Điều khoản Sử dụng.