OPEN-SOURCE SCRIPT
WaveTrend and Crossing EMA of RSIs by Alhazen
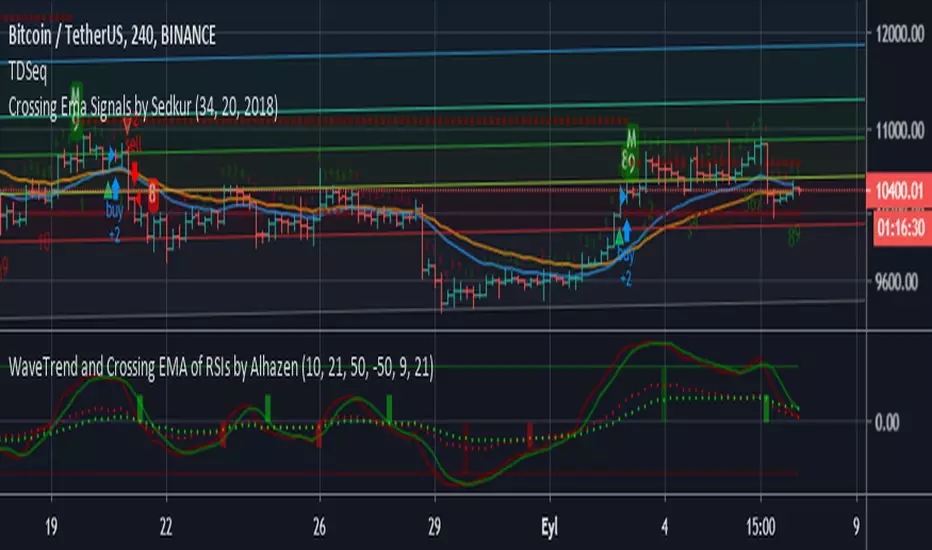
LazyBear's WaveTrend Oscilator is simplified, and buy & sell signals are added. Green bars indicate SELL signal of WT, and Maroon bars indicate BUY signal of WT.
A new indicator added: Crossing EMA of two RSI's. RSI plots are shown with dotted lines. Lime bars indicate SELL signal of RSI, and Red bars indicate BUY signal of RSI.
You can combine WT and RSI together and decide to BUY or SELL.
A new indicator added: Crossing EMA of two RSI's. RSI plots are shown with dotted lines. Lime bars indicate SELL signal of RSI, and Red bars indicate BUY signal of RSI.
You can combine WT and RSI together and decide to BUY or SELL.
Mã nguồn mở
Theo đúng tinh thần TradingView, tác giả của tập lệnh này đã công bố nó dưới dạng mã nguồn mở, để các nhà giao dịch có thể xem xét và xác minh chức năng. Chúc mừng tác giả! Mặc dù bạn có thể sử dụng miễn phí, hãy nhớ rằng việc công bố lại mã phải tuân theo Nội quy.
Thông báo miễn trừ trách nhiệm
Thông tin và các ấn phẩm này không nhằm mục đích, và không cấu thành, lời khuyên hoặc khuyến nghị về tài chính, đầu tư, giao dịch hay các loại khác do TradingView cung cấp hoặc xác nhận. Đọc thêm tại Điều khoản Sử dụng.