OPEN-SOURCE SCRIPT
Day of Week Performance
█ OVERVIEW
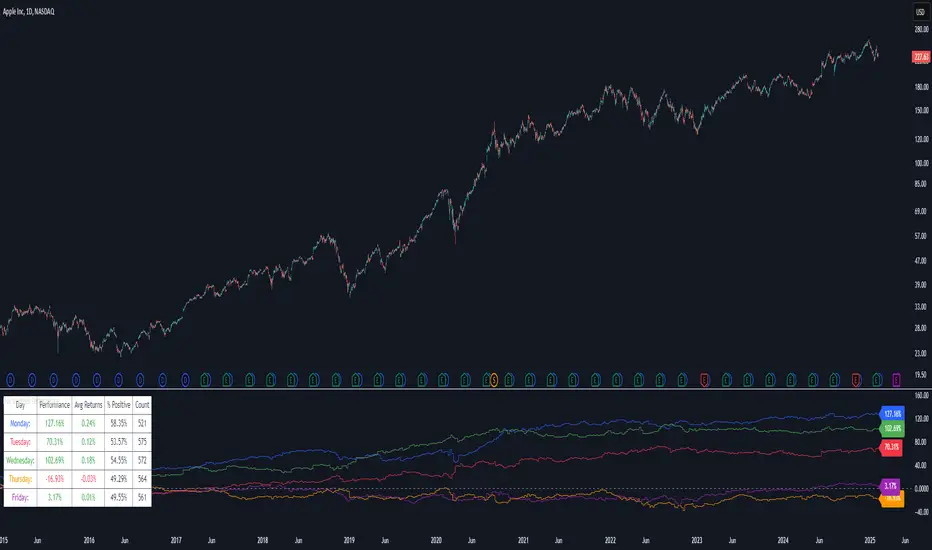
The Day of Week Performance indicator is designed to visualise and compare the cumulative percentage change for each day of the week. This indicator explores one of the many calendar based anomalies in financial markets.
In financial analysis, a calendar based anomaly refers to recurring patterns or tendencies associated with specific time periods, such as days of the week. By calculating the cumulative percentage change for each day (Monday through Friday) and displaying the results both graphically and in a summary table, this indicator helps identify whether certain days consistently outperform others.
█ FEATURES
█ HOW TO USE
Colour Scheme:
The Day of Week Performance indicator is designed to visualise and compare the cumulative percentage change for each day of the week. This indicator explores one of the many calendar based anomalies in financial markets.
In financial analysis, a calendar based anomaly refers to recurring patterns or tendencies associated with specific time periods, such as days of the week. By calculating the cumulative percentage change for each day (Monday through Friday) and displaying the results both graphically and in a summary table, this indicator helps identify whether certain days consistently outperform others.
█ FEATURES
- Customisable time window via Time Settings.
- Calculates cumulative percentage change for each day (Monday to Friday) separately.
- Option to use Sunday instead of Friday for CFDs and Futures analysis.
- Distinct visual representation for each day using unique colours.
- Customisable table settings including position and font size.
- Built-in error checks to ensure the indicator is applied on a Daily timeframe.
█ HOW TO USE
- Add the indicator to a chart set to a Daily timeframe.
- Select your desired Start Time and End Time in the Time Settings.
- Toggle the performance table on or off in the Table Settings.
- Adjust the table’s location and font size as needed.
- Use the "Use Sunday instead of Friday" option if your market requires it.
- View the cumulative performance plotted in distinct colours.
Colour Scheme:
- Monday: Blue
- Tuesday: Red
- Wednesday: Green
- Thursday: Orange
- Friday: Purple
Mã nguồn mở
Theo đúng tinh thần TradingView, tác giả của tập lệnh này đã công bố nó dưới dạng mã nguồn mở, để các nhà giao dịch có thể xem xét và xác minh chức năng. Chúc mừng tác giả! Mặc dù bạn có thể sử dụng miễn phí, hãy nhớ rằng việc công bố lại mã phải tuân theo Nội quy.
Thông báo miễn trừ trách nhiệm
Thông tin và các ấn phẩm này không nhằm mục đích, và không cấu thành, lời khuyên hoặc khuyến nghị về tài chính, đầu tư, giao dịch hay các loại khác do TradingView cung cấp hoặc xác nhận. Đọc thêm tại Điều khoản Sử dụng.