OPEN-SOURCE SCRIPT
Cập nhật MACD MTF Lines
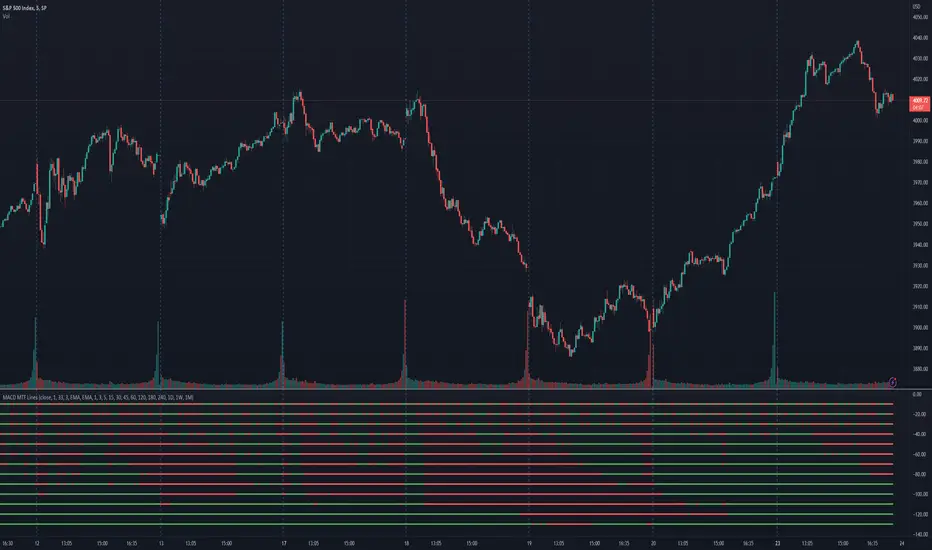
The indicator shows the MACD histogram sign (positive or negative) for several timeframes at once. You can see at a glance how the price is trending across higher and lower timeframes.
The code uses recursive calculations for the SMA and EMA to avoid lookahead errors and repainting on higher timeframes.
Note that, for lower timeframes, the line becomes yellow to the left because history is limited and there are not enough bars to calculate.
The code uses recursive calculations for the SMA and EMA to avoid lookahead errors and repainting on higher timeframes.
Note that, for lower timeframes, the line becomes yellow to the left because history is limited and there are not enough bars to calculate.
Phát hành các Ghi chú
The indicator was updated to show the maximum number of lines supported.Phát hành các Ghi chú
Each line can be enabled or disabled individually, so that unused ones can be hidden.Phát hành các Ghi chú
Added simple trend detection based on the number of bullish and bearish timeframes; threshold can be changed in Settings.Added data outputs:
* "Score": counting the net number of bullish and bearish timeframes
* "Trend": changes to bullish or bearish as the score goes over or under the threshold
Added background color (green or red according to trend); can be enabled in Settings.
Added alert for trend change.
Fix: named individual timeframe outputs.
Phát hành các Ghi chú
Added another alert with a separate threshold score for flexibility.Phát hành các Ghi chú
Fix: minimum values set to 1.Phát hành các Ghi chú
Added score weights for further customization of trend detection and alerts. Input parameters are now set in terms of score values instead of number of lines.Phát hành các Ghi chú
Release notes:Added input options to choose alert modes for trend and extra alerts. The options are:
* once per bar close (default)
* once per bar
* every time
Mã nguồn mở
Theo đúng tinh thần TradingView, tác giả của tập lệnh này đã công bố nó dưới dạng mã nguồn mở, để các nhà giao dịch có thể xem xét và xác minh chức năng. Chúc mừng tác giả! Mặc dù bạn có thể sử dụng miễn phí, hãy nhớ rằng việc công bố lại mã phải tuân theo Nội quy.
Thông báo miễn trừ trách nhiệm
Thông tin và các ấn phẩm này không nhằm mục đích, và không cấu thành, lời khuyên hoặc khuyến nghị về tài chính, đầu tư, giao dịch hay các loại khác do TradingView cung cấp hoặc xác nhận. Đọc thêm tại Điều khoản Sử dụng.