OPEN-SOURCE SCRIPT
Cập nhật [COG] WeatherForecaster
🌤️ Just like a weather forecast that adjusts as new data emerges, this TMA Pivot Points Forecaster adapts to evolving market conditions!
Description:
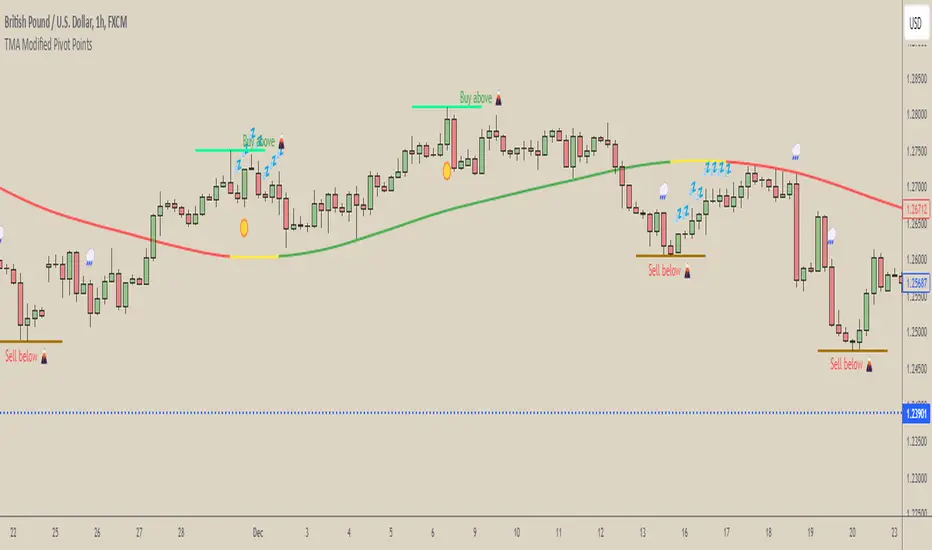
This indicator combines the power of a Triple Moving Average (TMA) with pivot point analysis to identify potential market turning points and trend directions. Like a meteorologist using various atmospheric data to predict weather patterns, this tool analyzes price action through multiple lenses to forecast potential market movements.
Key Features:
- Dynamic TMA Line: Acts as our "atmospheric pressure system," showing the underlying market direction
- Adaptive Pivot Points: Like weather stations, these pivots identify key market levels where the "climate" might change
- Smart Entry Signals: ☀️ and 🌧️ icons appear when conditions align for potential trades
- Timeframe-Adaptive: Automatically adjusts sensitivity across different timeframes
- Customizable Visuals: Adjust colors and styles to match your trading environment
Settings Include:
✓ TMA Length and Slope Sensitivity
✓ Pivot Point Parameters
✓ Visual Customization Options
✓ Toggle Entry Signals
✓ Toggle Pivot Lines
Note: Like weather forecasts that update with new data, this indicator recalculates as market conditions evolve. Past signals may adjust as more price action develops. Always use proper risk management and combine with other analysis tools.
Usage Guide:
The indicator works best when used as part of a complete trading system. Here's how to interpret the signals:
📈 Bullish Conditions:
- TMA Line turns green: Indicates upward momentum
- "Buy above 🌋" level appears: Potential resistance turned support level
- ☀️ Signal: Indicates favorable buying conditions
📉 Bearish Conditions:
- TMA Line turns red: Indicates downward momentum
- "Sell below 🌋" level appears: Potential support turned resistance level
- 🌧️ Signal: Indicates favorable selling conditions
⏺️ Ranging Conditions:
- TMA Line turns yellow: Market in consolidation
- 💤 Signal: Suggests waiting for clearer direction
Best Practices:
1. Higher timeframes (4H, Daily) tend to produce more reliable signals
2. Use the pivot lines as potential entry/exit reference points
3. Adjust the TMA length based on your trading style:
• Shorter lengths (20-30) for more active trading
• Longer lengths (50-60) for trend following
Settings Explained:
TMA Settings:
- TMA Length: Determines the smoothing period (default: 30)
- Slope Threshold: Controls trend sensitivity (default: 0.015)
Pivot Settings:
- Left/Right Bars: Controls pivot point calculation
- Line Length: Adjusts the visual length of pivot lines
- Line Style & Colors: Customize the visual appearance
Disclaimer:
Past performance does not guarantee future results. This indicator, like any technical tool, provides possibilities rather than certainties. Please test thoroughly on your preferred timeframes and markets before using with real capital.
Description:
This indicator combines the power of a Triple Moving Average (TMA) with pivot point analysis to identify potential market turning points and trend directions. Like a meteorologist using various atmospheric data to predict weather patterns, this tool analyzes price action through multiple lenses to forecast potential market movements.
Key Features:
- Dynamic TMA Line: Acts as our "atmospheric pressure system," showing the underlying market direction
- Adaptive Pivot Points: Like weather stations, these pivots identify key market levels where the "climate" might change
- Smart Entry Signals: ☀️ and 🌧️ icons appear when conditions align for potential trades
- Timeframe-Adaptive: Automatically adjusts sensitivity across different timeframes
- Customizable Visuals: Adjust colors and styles to match your trading environment
Settings Include:
✓ TMA Length and Slope Sensitivity
✓ Pivot Point Parameters
✓ Visual Customization Options
✓ Toggle Entry Signals
✓ Toggle Pivot Lines
Note: Like weather forecasts that update with new data, this indicator recalculates as market conditions evolve. Past signals may adjust as more price action develops. Always use proper risk management and combine with other analysis tools.
Usage Guide:
The indicator works best when used as part of a complete trading system. Here's how to interpret the signals:
📈 Bullish Conditions:
- TMA Line turns green: Indicates upward momentum
- "Buy above 🌋" level appears: Potential resistance turned support level
- ☀️ Signal: Indicates favorable buying conditions
📉 Bearish Conditions:
- TMA Line turns red: Indicates downward momentum
- "Sell below 🌋" level appears: Potential support turned resistance level
- 🌧️ Signal: Indicates favorable selling conditions
⏺️ Ranging Conditions:
- TMA Line turns yellow: Market in consolidation
- 💤 Signal: Suggests waiting for clearer direction
Best Practices:
1. Higher timeframes (4H, Daily) tend to produce more reliable signals
2. Use the pivot lines as potential entry/exit reference points
3. Adjust the TMA length based on your trading style:
• Shorter lengths (20-30) for more active trading
• Longer lengths (50-60) for trend following
Settings Explained:
TMA Settings:
- TMA Length: Determines the smoothing period (default: 30)
- Slope Threshold: Controls trend sensitivity (default: 0.015)
Pivot Settings:
- Left/Right Bars: Controls pivot point calculation
- Line Length: Adjusts the visual length of pivot lines
- Line Style & Colors: Customize the visual appearance
Disclaimer:
Past performance does not guarantee future results. This indicator, like any technical tool, provides possibilities rather than certainties. Please test thoroughly on your preferred timeframes and markets before using with real capital.
Phát hành các Ghi chú
small adjustmentMã nguồn mở
Theo đúng tinh thần TradingView, tác giả của tập lệnh này đã công bố nó dưới dạng mã nguồn mở, để các nhà giao dịch có thể xem xét và xác minh chức năng. Chúc mừng tác giả! Mặc dù bạn có thể sử dụng miễn phí, hãy nhớ rằng việc công bố lại mã phải tuân theo Nội quy.
CognitiveAlpha
Thông báo miễn trừ trách nhiệm
Thông tin và các ấn phẩm này không nhằm mục đích, và không cấu thành, lời khuyên hoặc khuyến nghị về tài chính, đầu tư, giao dịch hay các loại khác do TradingView cung cấp hoặc xác nhận. Đọc thêm tại Điều khoản Sử dụng.
Mã nguồn mở
Theo đúng tinh thần TradingView, tác giả của tập lệnh này đã công bố nó dưới dạng mã nguồn mở, để các nhà giao dịch có thể xem xét và xác minh chức năng. Chúc mừng tác giả! Mặc dù bạn có thể sử dụng miễn phí, hãy nhớ rằng việc công bố lại mã phải tuân theo Nội quy.
CognitiveAlpha
Thông báo miễn trừ trách nhiệm
Thông tin và các ấn phẩm này không nhằm mục đích, và không cấu thành, lời khuyên hoặc khuyến nghị về tài chính, đầu tư, giao dịch hay các loại khác do TradingView cung cấp hoặc xác nhận. Đọc thêm tại Điều khoản Sử dụng.