OPEN-SOURCE SCRIPT
Cập nhật Top Cap ADD%
This is a very basic oscillator that plots the average % change of the top 5 highest market cap stocks in the S&P500. It can be easily modified to suit your needs on which stocks you'd like to track, and or filter out the threshold you're looking for.
Phát hành các Ghi chú
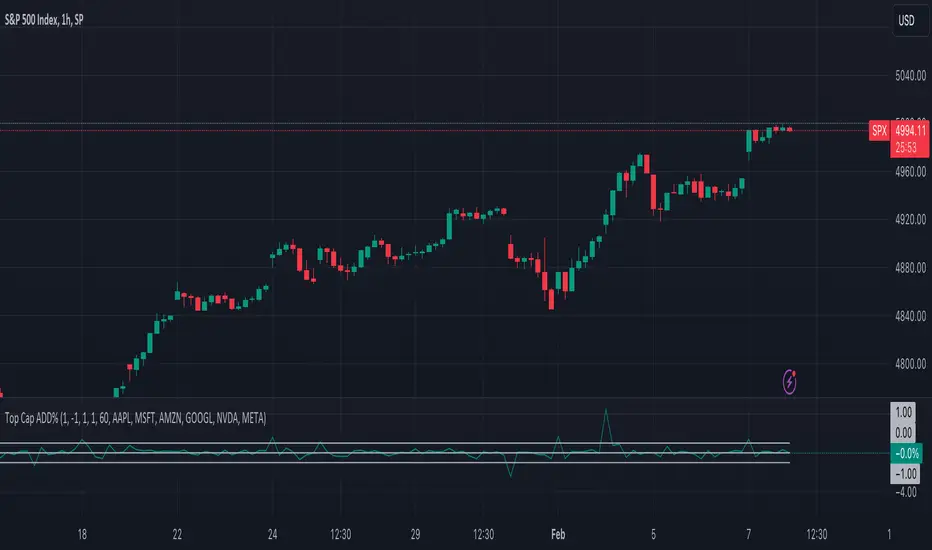
This is a very basic oscillator that plots the average % change of the top 6 highest market cap stocks in the S&P500. It can be easily modified to suit your needs on which stocks you'd like to track, and or filter out the threshold you're looking for.The v2 update includes the following changes:
- Fixed a timeframe oversight, the original script forces you to the daily timeframe, you can now select the timeframe you want, this is brings much more versatility to both short term and long term traders.
- The limits are changed from integers to floats, this fixed oversight allows you to have much more control over the outliers you are looking for.
- I have also added
- Background is slightly more transparent by default for better visuals.
Mã nguồn mở
Theo đúng tinh thần TradingView, tác giả của tập lệnh này đã công bố nó dưới dạng mã nguồn mở, để các nhà giao dịch có thể xem xét và xác minh chức năng. Chúc mừng tác giả! Mặc dù bạn có thể sử dụng miễn phí, hãy nhớ rằng việc công bố lại mã phải tuân theo Nội quy.
Thông báo miễn trừ trách nhiệm
Thông tin và các ấn phẩm này không nhằm mục đích, và không cấu thành, lời khuyên hoặc khuyến nghị về tài chính, đầu tư, giao dịch hay các loại khác do TradingView cung cấp hoặc xác nhận. Đọc thêm tại Điều khoản Sử dụng.