OPEN-SOURCE SCRIPT
Daily Performance Heatmap

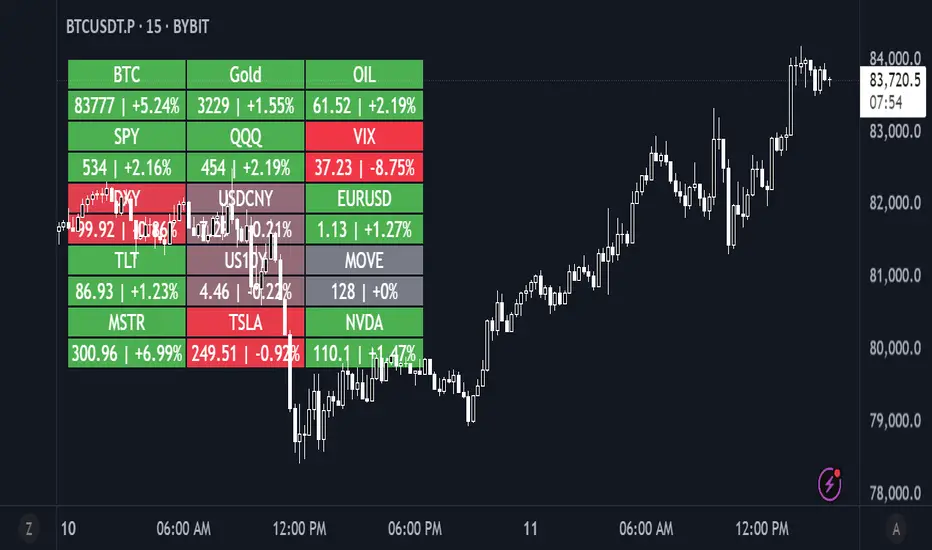
This script displays a customizable daily performance heatmap for key assets across crypto, equities, bonds, commodities, currencies, and volatility indices.
Each cell shows the current price and the percent change since the daily open, color-coded using a gradient from negative to positive. Assets are arranged in a left-to-right, top-down grid, with adjustable layout and styling.
⚙️ Features:
🔢 Displays current price and daily % change
🎨 Color-coded heatmap using customizable gradients
🧱 Adjustable layout: number of columns, cell size, and text size
🧠 Smart price formatting (no decimals for BTC, Gold, etc.)
🪟 Clean alignment with padded spacing for UI clarity
🛠️ Future plans:
User-input asset lists and labels
Category grouping and dynamic sorting
Optional icons, tooltips, or alerts
Mã nguồn mở
Theo đúng tinh thần TradingView, tác giả của tập lệnh này đã công bố nó dưới dạng mã nguồn mở, để các nhà giao dịch có thể xem xét và xác minh chức năng. Chúc mừng tác giả! Mặc dù bạn có thể sử dụng miễn phí, hãy nhớ rằng việc công bố lại mã phải tuân theo Nội quy.
Thông báo miễn trừ trách nhiệm
Thông tin và các ấn phẩm này không nhằm mục đích, và không cấu thành, lời khuyên hoặc khuyến nghị về tài chính, đầu tư, giao dịch hay các loại khác do TradingView cung cấp hoặc xác nhận. Đọc thêm tại Điều khoản Sử dụng.