OPEN-SOURCE SCRIPT
Dual Bollinger Bands (20 & 200)
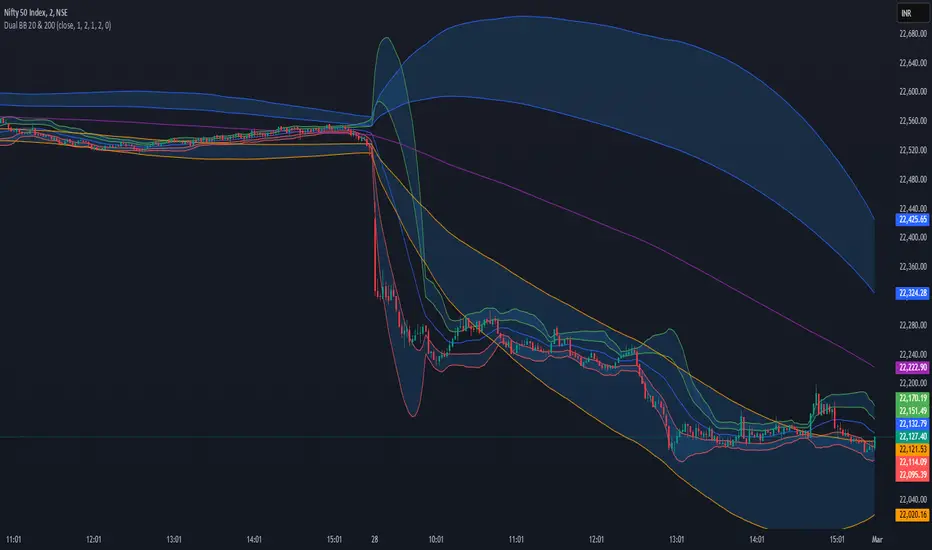
Dual Bollinger Bands (20 & 200) - Enhanced Trading Strategy
Overview
The Dual Bollinger Bands (20 & 200) indicator is an enhanced version of the Double Bollinger Bands by Alixnet. This advanced tool integrates two sets of Bollinger Bands with 20-period (short-term) and 200-period (long-term) moving averages, helping traders identify market trends, volatility, and potential trade setups more effectively.
Key Features
✅ Two Bollinger Band Sets – Short-term (20-period) and Long-term (200-period).
✅ Enable/Disable Each BB – Customize visibility for better analysis.
✅ Multiple Standard Deviations – Identify different levels of volatility.
✅ Background Fill for Clarity – Highlights volatility zones.
How to Use This Indicator Effectively
1. Understanding the Two Bollinger Bands
BB1 (20-Period): Measures short-term price movements and volatility.
BB2 (200-Period): Acts as a long-term trend filter to determine the dominant trend.
2. Trade Entries & Exits
Bullish Trade Setup (Long Entry)
🔹 Price Above 200 MA Basis Line (BB2) – Confirms an uptrend.
🔹 Price Pulls Back to the Lower Band of BB1 (20 MA) – Ideal buy opportunity.
🔹 Confirmation: If price bounces off the lower BB1 band and moves back toward the midline or upper band, enter a long position.
🔹 Exit: When price touches or exceeds the upper BB1 band.
Bearish Trade Setup (Short Entry)
🔹 Price Below 200 MA Basis Line (BB2) – Confirms a downtrend.
🔹 Price Pulls Back to the Upper Band of BB1 (20 MA) – Ideal short opportunity.
🔹 Confirmation: If price gets rejected at the upper BB1 band and moves downward, enter a short position.
🔹 Exit: When price reaches or drops below the lower BB1 band.
3. Avoiding Sideways Markets
❌ Avoid trading when price stays between the two bands of BB1 without breaking out.
❌ Flat 200 MA Line (BB2 Basis) indicates a ranging market – best to wait for a breakout.
✅ Wait for Price to Cross the 200 MA Basis Line to confirm trend direction before entering trades.
4. Catching Trending Moves
✅ Strong Trend Confirmation: When price stays above or below the 20-period BB bands and also above/below the 200-period MA.
✅ Trend Continuation: If price consolidates near the upper or lower bands without breaking opposite levels.
✅ Breakout Confirmation: Look for a candle close outside BB1 bands with momentum to confirm strong moves.
Final Thoughts
The Dual Bollinger Bands (20 & 200) indicator is a powerful tool for both short-term traders and long-term investors. By combining the short-term volatility of the 20-period BB with the long-term trend of the 200-period BB, traders can make more informed trading decisions, filter out noise, and capture high-probability trade setups.
Mã nguồn mở
Theo đúng tinh thần TradingView, tác giả của tập lệnh này đã công bố nó dưới dạng mã nguồn mở, để các nhà giao dịch có thể xem xét và xác minh chức năng. Chúc mừng tác giả! Mặc dù bạn có thể sử dụng miễn phí, hãy nhớ rằng việc công bố lại mã phải tuân theo Nội Quy.
Thông báo miễn trừ trách nhiệm
Thông tin và các ấn phẩm này không nhằm mục đích, và không cấu thành, lời khuyên hoặc khuyến nghị về tài chính, đầu tư, giao dịch hay các loại khác do TradingView cung cấp hoặc xác nhận. Đọc thêm tại Điều khoản Sử dụng.