OPEN-SOURCE SCRIPT
Wick Strength [MS]
Overview
The Wick Strength indicator is a unique script designed to measure and visualize the relative strength of candlestick wicks over time. By analyzing the relationship between upper and lower wicks, this indicator provides insights into potential market dynamics and price action patterns.
How It Works
The Wick Strength indicator calculates the "strength" of candlestick wicks by comparing the upward and downward movements within each candle's range. This calculation results in a dynamic line plot that represents the evolving wick strength across your chosen timeframe.
Strength is not range-bound, allowing the score to reach extremes and be compared relatively across time.
Interpretation
Key Features
Measures relative wick strength candle by candle
Smooths the values by summation based on user preference
Adaptable to all timeframes and markets
Potential Applications
While extensive backtesting has not been performed, the Wick Strength indicator may offer valuable insights for:
The Wick Strength indicator is a unique script designed to measure and visualize the relative strength of candlestick wicks over time. By analyzing the relationship between upper and lower wicks, this indicator provides insights into potential market dynamics and price action patterns.
How It Works
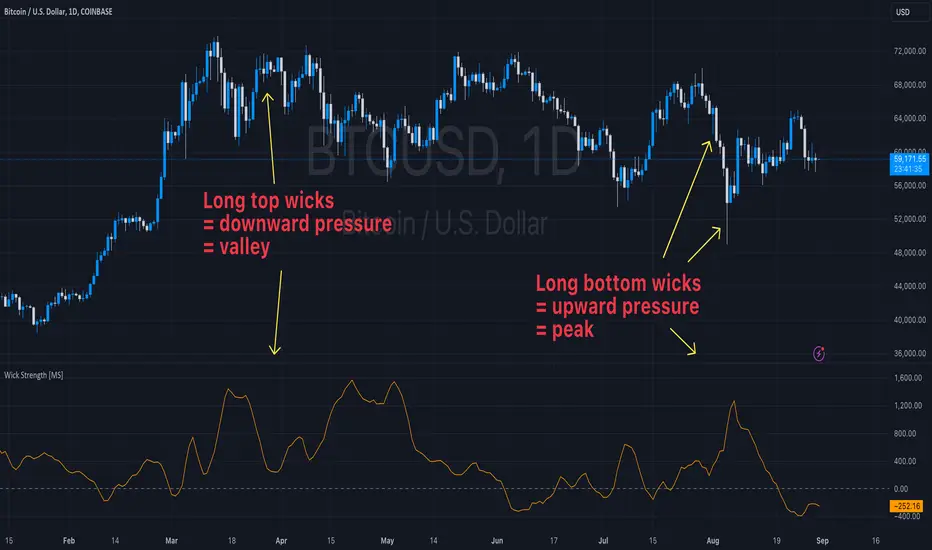
The Wick Strength indicator calculates the "strength" of candlestick wicks by comparing the upward and downward movements within each candle's range. This calculation results in a dynamic line plot that represents the evolving wick strength across your chosen timeframe.
Strength is not range-bound, allowing the score to reach extremes and be compared relatively across time.
Interpretation
- Positive values indicate stronger upper wicks (potential bearish pressure)
- Negative values suggest stronger lower wicks (potential bullish pressure)
- Extreme readings might signal overextended moves or potential reversals
Key Features
Measures relative wick strength candle by candle
Smooths the values by summation based on user preference
Adaptable to all timeframes and markets
Potential Applications
While extensive backtesting has not been performed, the Wick Strength indicator may offer valuable insights for:
- Identifying potential divergences between price action and wick strength
- Spotting changes in market sentiment or volatility
- Complementing other technical analysis tools for a more comprehensive trading approach
- Developing unique trading strategies based on wick behavior
Mã nguồn mở
Theo đúng tinh thần TradingView, tác giả của tập lệnh này đã công bố nó dưới dạng mã nguồn mở, để các nhà giao dịch có thể xem xét và xác minh chức năng. Chúc mừng tác giả! Mặc dù bạn có thể sử dụng miễn phí, hãy nhớ rằng việc công bố lại mã phải tuân theo Nội quy.
For script access or PineScript questions, please visit our site:
marketscripters.com?utm_source=tradingview&utm_medium=signature
marketscripters.com?utm_source=tradingview&utm_medium=signature
Thông báo miễn trừ trách nhiệm
Thông tin và các ấn phẩm này không nhằm mục đích, và không cấu thành, lời khuyên hoặc khuyến nghị về tài chính, đầu tư, giao dịch hay các loại khác do TradingView cung cấp hoặc xác nhận. Đọc thêm tại Điều khoản Sử dụng.