OPEN-SOURCE SCRIPT
Cập nhật 9-20 sma multi timeframe indicator
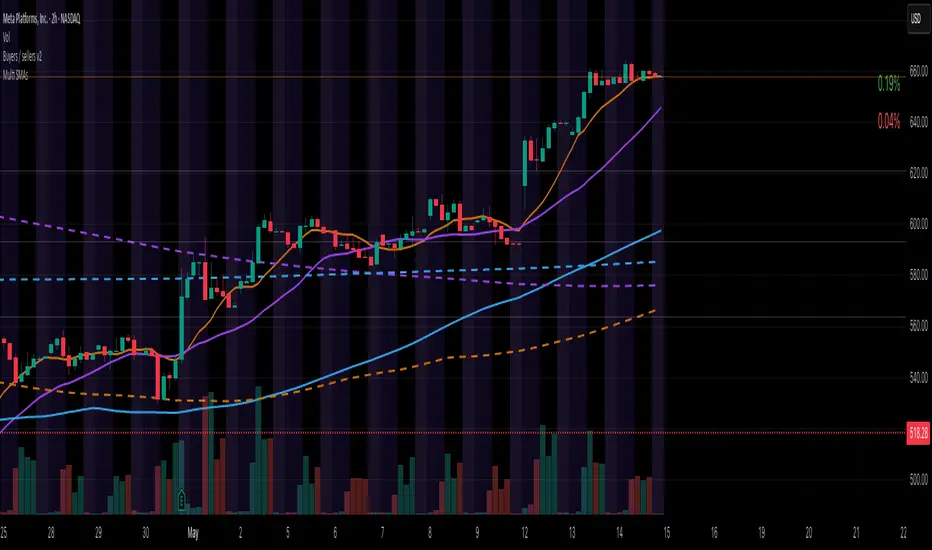
This is an indicator to help visualizing the 9 and the 20 sma on 3 different timeframes.
When they cross, you will see a cross on the band representing the timeframe.
When a trade is favorable the band will color in green for up trend and in red for downtrend:
- Conditions in uptrend: Start after the first green candle closed above the 9 sma, Stop after the first red candle closed under the 9 sma
- Conditions in downtrend: Start after the first red candle closed below the 9 sma, Stop after the first green candle closed above the 9 sma
Phát hành các Ghi chú
updated titlePhát hành các Ghi chú
Fixed timeframe calculation for the "D" taking into account extended market / futures / cryptoMã nguồn mở
Theo đúng tinh thần TradingView, tác giả của tập lệnh này đã công bố nó dưới dạng mã nguồn mở, để các nhà giao dịch có thể xem xét và xác minh chức năng. Chúc mừng tác giả! Mặc dù bạn có thể sử dụng miễn phí, hãy nhớ rằng việc công bố lại mã phải tuân theo Nội quy.
Thông báo miễn trừ trách nhiệm
Thông tin và các ấn phẩm này không nhằm mục đích, và không cấu thành, lời khuyên hoặc khuyến nghị về tài chính, đầu tư, giao dịch hay các loại khác do TradingView cung cấp hoặc xác nhận. Đọc thêm tại Điều khoản Sử dụng.
Mã nguồn mở
Theo đúng tinh thần TradingView, tác giả của tập lệnh này đã công bố nó dưới dạng mã nguồn mở, để các nhà giao dịch có thể xem xét và xác minh chức năng. Chúc mừng tác giả! Mặc dù bạn có thể sử dụng miễn phí, hãy nhớ rằng việc công bố lại mã phải tuân theo Nội quy.
Thông báo miễn trừ trách nhiệm
Thông tin và các ấn phẩm này không nhằm mục đích, và không cấu thành, lời khuyên hoặc khuyến nghị về tài chính, đầu tư, giao dịch hay các loại khác do TradingView cung cấp hoặc xác nhận. Đọc thêm tại Điều khoản Sử dụng.