OPEN-SOURCE SCRIPT
D/W/M RSI & %CHNG + ATR
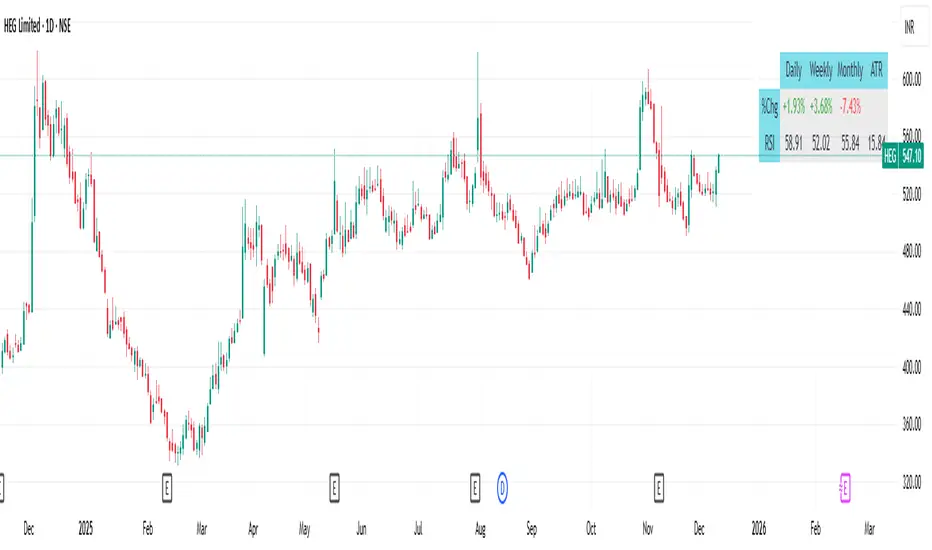
This indicator provides a comprehensive, at-a-glance dashboard displaying key technical metrics across multiple timeframes: Daily, Weekly, and Monthly. It tracks Price Change Percentage, Relative Strength Index (RSI), and Average True Range (ATR) for each timeframe, helping traders quickly assess market trends, momentum, and volatility in one view.
Key Features:
Price Change % (Daily/Weekly/Monthly):
Displays the percentage change in price over the selected timeframes, giving traders insight into short-term, medium-term, and long-term price movement trends.
Relative Strength Index (RSI):
Shows the RSI value on Daily, Weekly, and Monthly timeframes. The RSI measures momentum, indicating overbought or oversold conditions:
Average True Range (ATR):
Tracks the ATR across multiple timeframes to assess market volatility. Higher ATR values signify more significant price movement (higher volatility), while lower values suggest quieter markets.
This indicator helps traders make informed decisions by quickly visualizing price momentum, market volatility, and possible trend reversals. It's ideal for swing traders, day traders, and long-term investors who need a bird's-eye view of the market across different timeframes.
How to Use:
Add the indicator to your TradingView chart.
Review the Price Change % to see how the market is trending across the selected timeframes.
Use the RSI to identify overbought or oversold conditions.
Check the ATR to assess current market volatility and adjust position sizes accordingly.
Mã nguồn mở
Theo đúng tinh thần TradingView, tác giả của tập lệnh này đã công bố nó dưới dạng mã nguồn mở, để các nhà giao dịch có thể xem xét và xác minh chức năng. Chúc mừng tác giả! Mặc dù bạn có thể sử dụng miễn phí, hãy nhớ rằng việc công bố lại mã phải tuân theo Nội quy.
Thông báo miễn trừ trách nhiệm
Thông tin và các ấn phẩm này không nhằm mục đích, và không cấu thành, lời khuyên hoặc khuyến nghị về tài chính, đầu tư, giao dịch hay các loại khác do TradingView cung cấp hoặc xác nhận. Đọc thêm tại Điều khoản Sử dụng.