OPEN-SOURCE SCRIPT
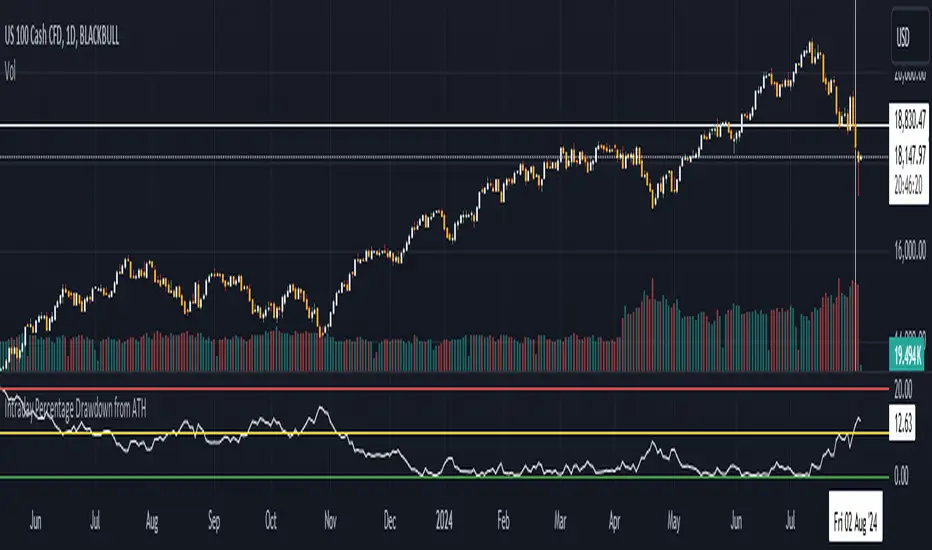
Intraday Percentage Drawdown from ATH
Track Intraday ATH:
The script maintains an intradayATH variable to track the highest price reached during the trading day up to the current point.
This variable is updated whenever a new high is reached.
Calculate Drawdown and Percentage Drawdown:
The drawdown is calculated as the difference between the intradayATH and the current closing price (close).
The percentage drawdown is calculated by dividing the drawdown by the intradayATH and multiplying by 100.
Plot Percentage Drawdown:
The percentageDrawdown is plotted on the chart with a red line to visually represent the drawdown from the intraday all-time high.
Draw Recession Line:
A horizontal red line is drawn at the 20.00 level, labeled "Recession". The line is styled as dotted and has a width of 2 for better visibility.
Draw Correction Line:
A horizontal yellow line is drawn at the 10.00 level, labeled "Correction". The line is styled as dotted and has a width of 2 for better visibility.
Draw All Time High Line:
A horizontal green line is drawn at the 0.0 level to represent the all-time high, labeled "All Time High". The line is styled as dotted and has a width of 2 for better visibility.
This script will display the percentage drawdown along with reference lines at 20% (recession), 10% (correction), and 0% (all-time high).
Mã nguồn mở
Theo đúng tinh thần TradingView, tác giả của tập lệnh này đã công bố nó dưới dạng mã nguồn mở, để các nhà giao dịch có thể xem xét và xác minh chức năng. Chúc mừng tác giả! Mặc dù bạn có thể sử dụng miễn phí, hãy nhớ rằng việc công bố lại mã phải tuân theo Nội quy.
Thông báo miễn trừ trách nhiệm
Thông tin và các ấn phẩm này không nhằm mục đích, và không cấu thành, lời khuyên hoặc khuyến nghị về tài chính, đầu tư, giao dịch hay các loại khác do TradingView cung cấp hoặc xác nhận. Đọc thêm tại Điều khoản Sử dụng.