OPEN-SOURCE SCRIPT
Bitcoin Reversal Predictor

Overview
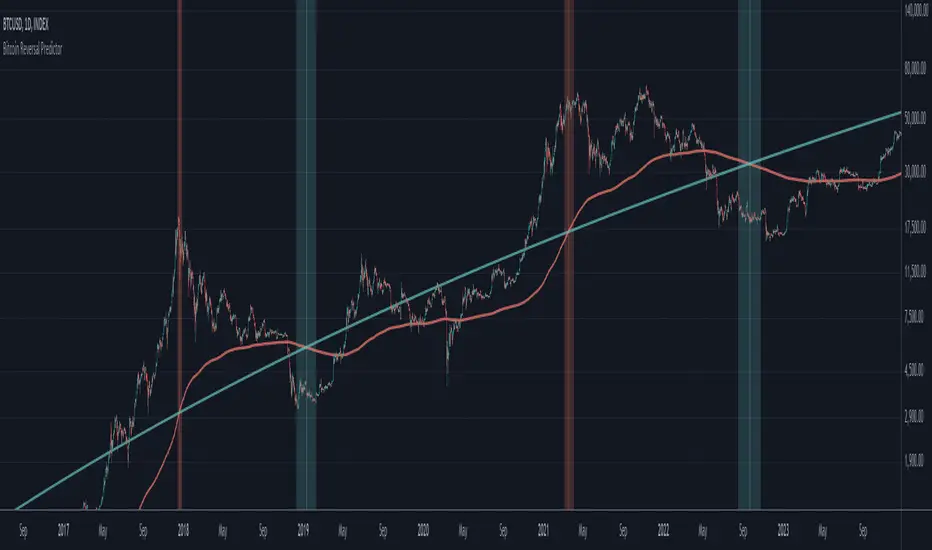
This indicator displays two lines that, when they cross, signal a potential reversal in Bitcoin's price trend. Historically, the high or low of a bull market cycle often occurs near the moment these lines intersect. The lines consist of an Exponential Moving Average (EMA) and a logarithmic regression line fitted to all of Bitcoin's historical data.
Inspiration
The inspiration for this indicator came from the PI Cycle Top indicator, which has accurately predicted past bull market peaks. However, I believe the PI Cycle Top indicator may not be as effective in the future. In that indicator, two lines cross to mark the top, but the extent of the cross has been diminishing over time. This was especially noticeable in the 2021 cycle, where the lines barely crossed. Because of this, I created a new indicator that I think will continue to provide reliable reversal signals in the future.
How It Works
The logarithmic regression line is fitted to the Bitcoin (BTCUSD) chart using two key factors: the 'a' factor (slope) and the 'b' factor (intercept). This results in a steadily decreasing line. The EMA oscillates above and below this regression line. Each time the two lines cross, a vertical colored bar appears, indicating that Bitcoin's price momentum is likely to reverse.
Use Cases
- Price Bottoming:
Bitcoin often bottoms out when the EMA crosses below the logarithmic regression line.
- Price Topping:
In contrast, Bitcoin often peaks when the EMA crosses above the logarithmic regression line.
- Profitable Strategy:
Trading at the crossovers of these lines can be a profitable strategy, as these moments often signal significant price reversals.
Mã nguồn mở
Theo đúng tinh thần TradingView, tác giả của tập lệnh này đã công bố nó dưới dạng mã nguồn mở, để các nhà giao dịch có thể xem xét và xác minh chức năng. Chúc mừng tác giả! Mặc dù bạn có thể sử dụng miễn phí, hãy nhớ rằng việc công bố lại mã phải tuân theo Nội quy.
Thông báo miễn trừ trách nhiệm
Thông tin và các ấn phẩm này không nhằm mục đích, và không cấu thành, lời khuyên hoặc khuyến nghị về tài chính, đầu tư, giao dịch hay các loại khác do TradingView cung cấp hoặc xác nhận. Đọc thêm tại Điều khoản Sử dụng.